- The paper conducts a detailed energy consumption analysis, revealing the impact of idle, boot-up, and stress tasks on overall system performance.
- It employs sensor-based monitoring and stress testing to evaluate energy demands, identifying image processing as the most energy-intensive process.
- The study emphasizes wired connectivity for energy efficiency and proposes methods to optimize energy use in sustainable beekeeping operations.
Energy Consumption in Precision Beekeeping Systems
Abstract and Objectives
The paper "Analysis of Energy Consumption in a Precision Beekeeping System" (2010.14934) explores the energy usage patterns of a precision beekeeping system that employs IoT technologies for smart agriculture applications. The primary objective is to provide a comprehensive analysis of energy consumption across various components and tasks inherent to the system, which is essential for designing energy-efficient and sustainable beekeeping operations.
Introduction and System Architecture
Precision agriculture, especially in apiculture, necessitates the integration of intelligent digital technologies to optimize data collection and decision-making processes amid environmental challenges. This paper addresses these needs by presenting a detailed examination of a precision beekeeping system named "Makers' Beehives," equipped with IoT components powered by solar energy. The system consists of standard beehives augmented with a solar roof and a sensor-rich base (Figure 1).
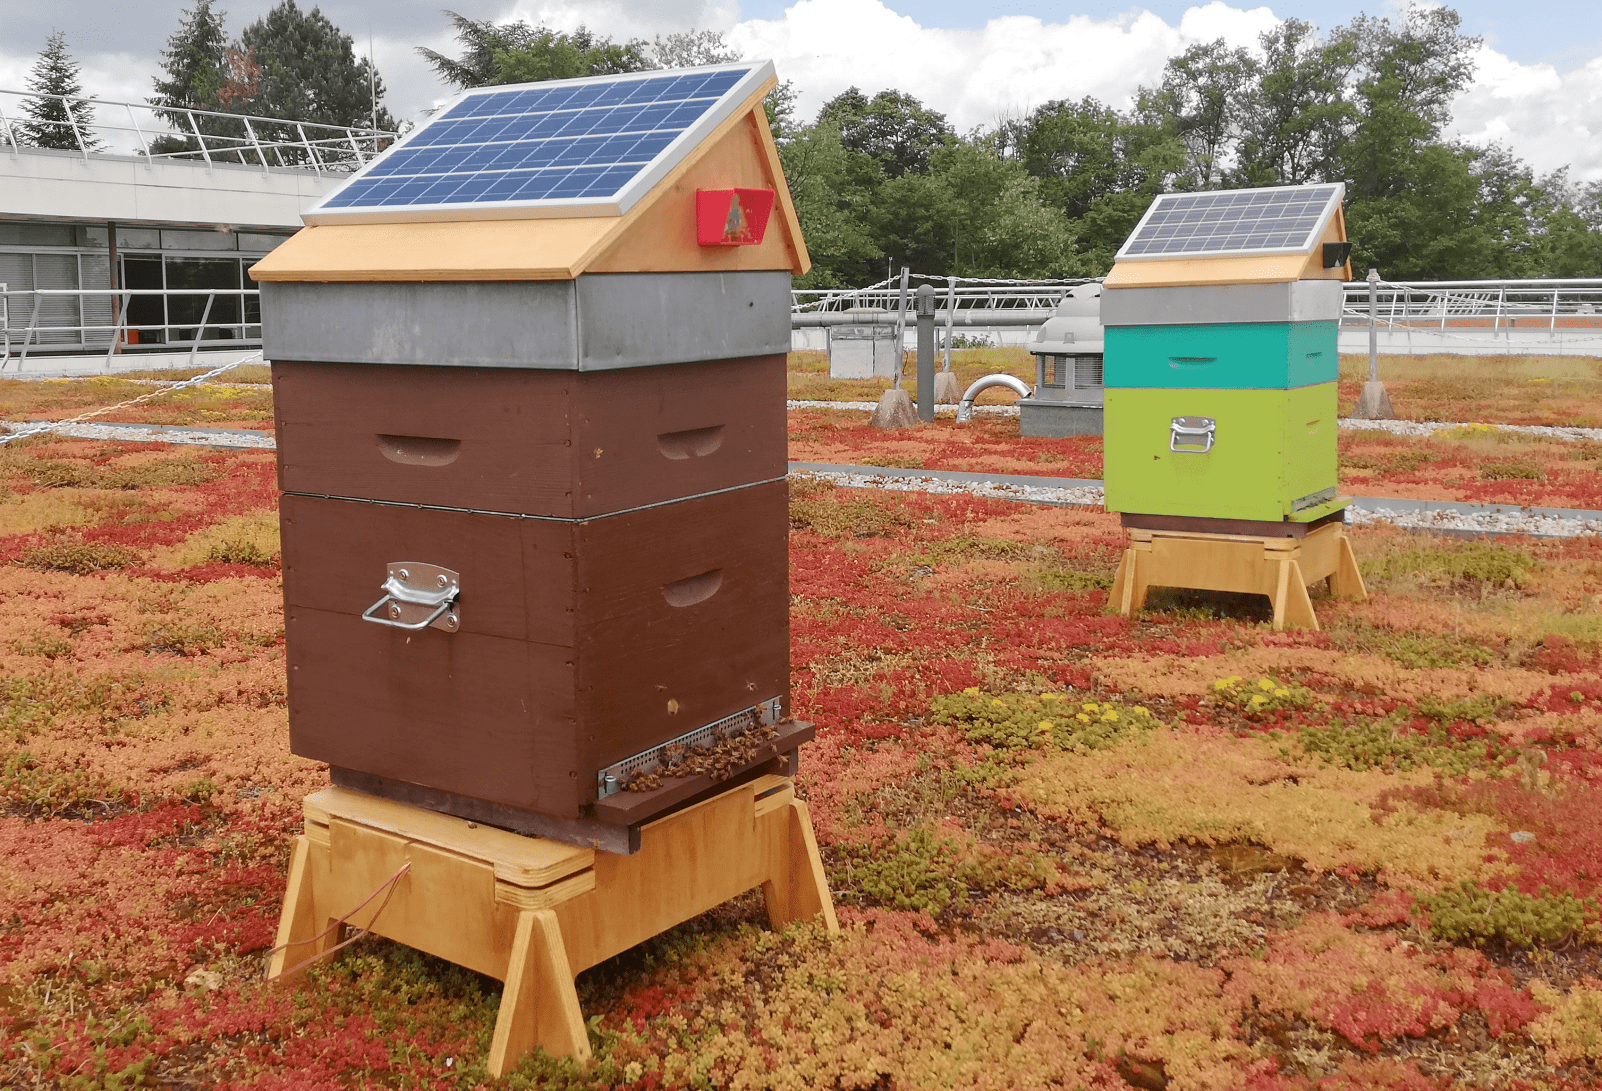
Figure 1: Two precision beekeeping systems deployed on site.
Key electronic components of the Makers' Beehive include a Raspberry Pi micro-computer, an Arduino unit, and a Raspberry Pi Camera, powered by a LiPo battery and supplemented by solar energy. Through energy profiling, the system identifies consumption patterns to guide the development of sustainable and autonomous beekeeping technologies.
Experimental Setup and Methodology
The paper outlines an indoor experimental setup aimed at monitoring and profiling the energy consumption of the Makers' Beehive. This setup utilizes sensor nodes identical to those in the beehive system, connected to external power sources for controlled testing. Sensors measure various parameters such as temperature, humidity, noise, light levels, and gas concentrations.
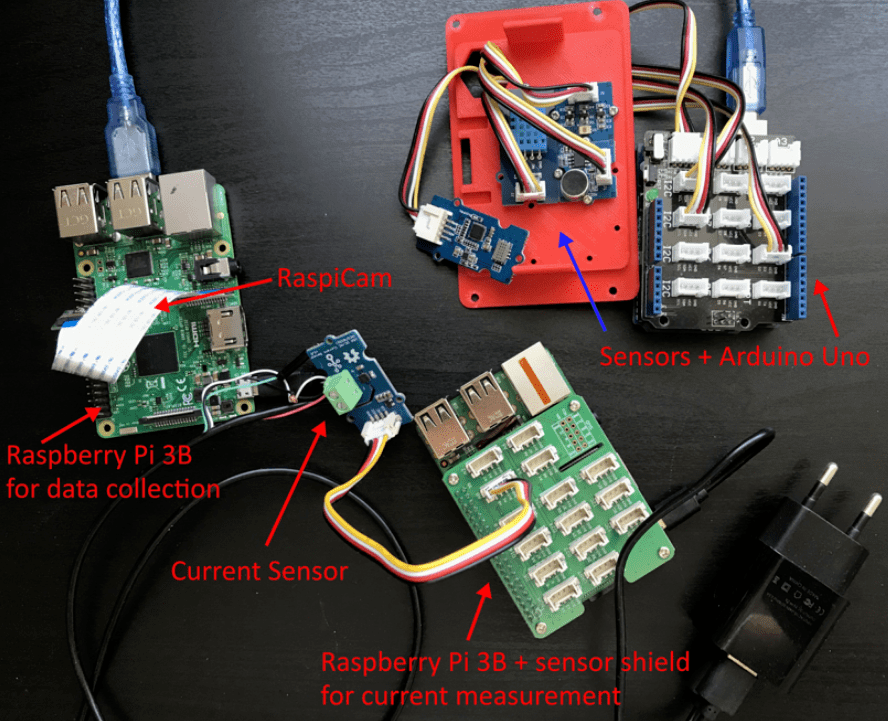
Figure 2: Experimental setup for monitoring energy consumption.
A step-wise data acquisition process is explained in detail, consisting of system wake-up, environmental data capture, image processing, and data transmission. Each stage is meticulously analyzed to pinpoint energy-intensive tasks.
Energy Consumption Analysis
Idle and Boot-up Consumption
The analysis begins by evaluating the baseline energy consumption when the Raspberry Pi is in idle mode. Profound insights into peripherals' impact are obtained, highlighting a significant energy penalty when Arduino is connected.
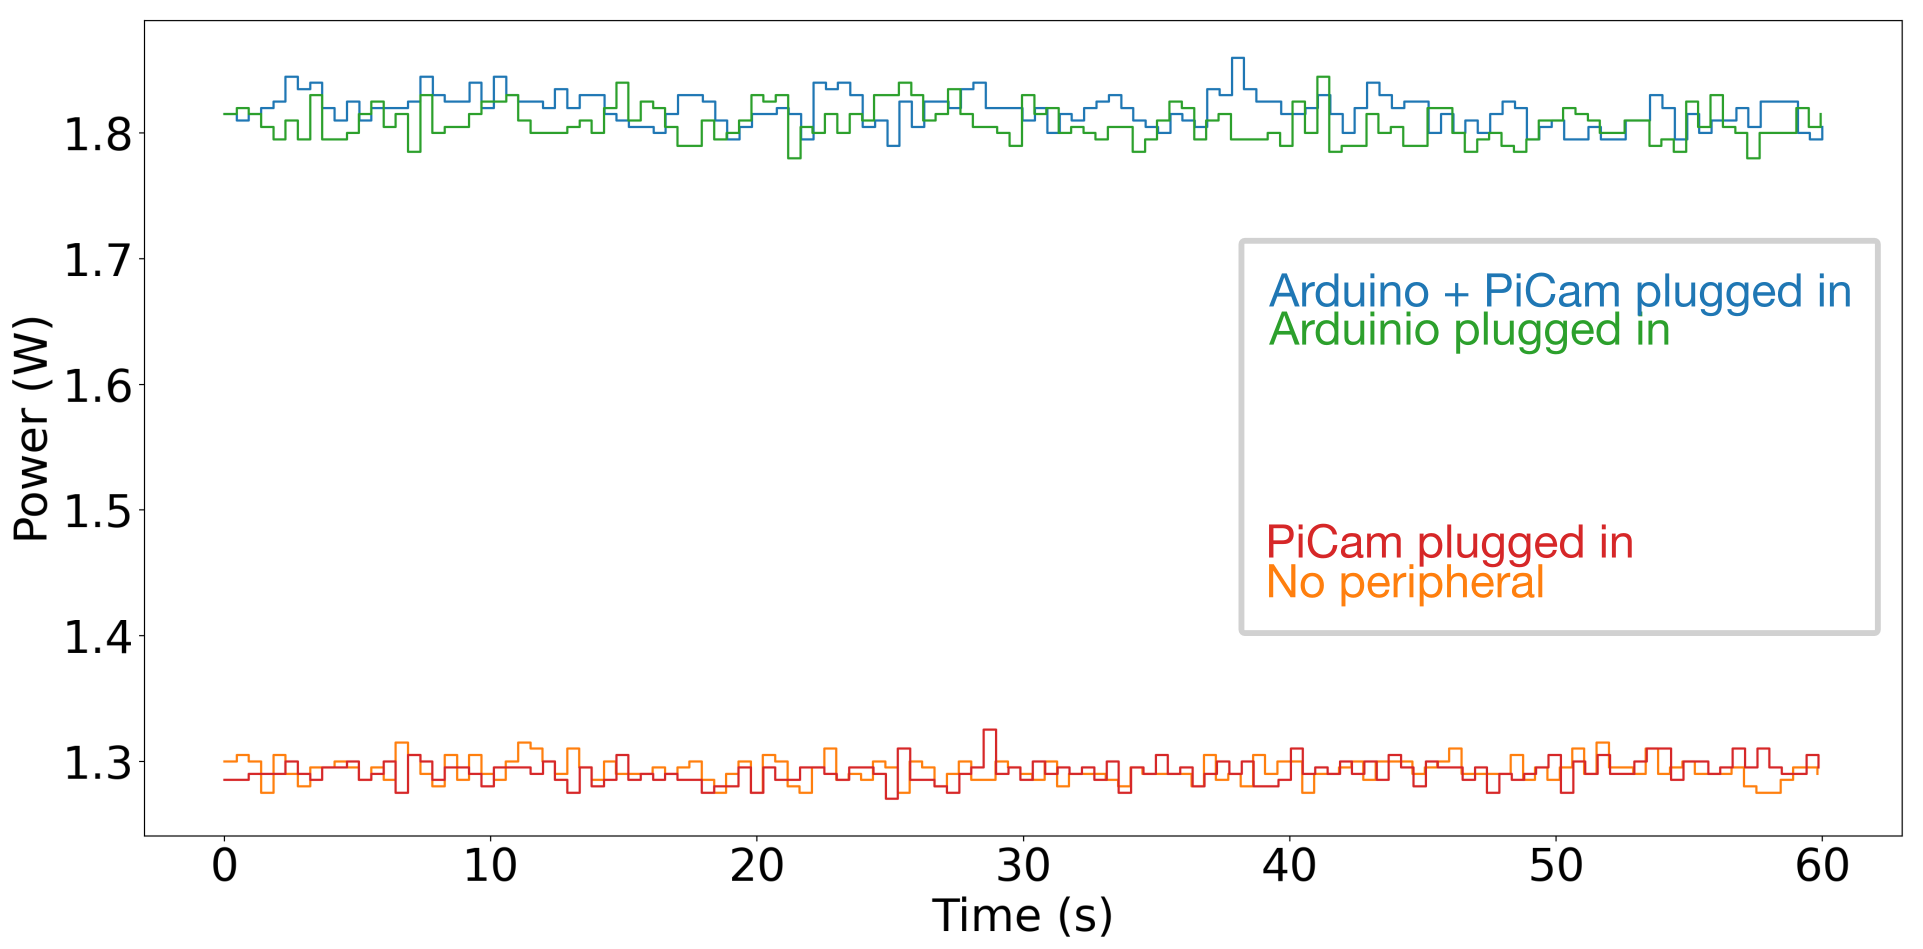
Figure 3: Power consumption of a Raspberry Pi in Idle mode over a 60-second time window.
Similarly, detailed power usage profiles during boot and shutdown phases provide crucial data for optimizing operational start-up sequences.
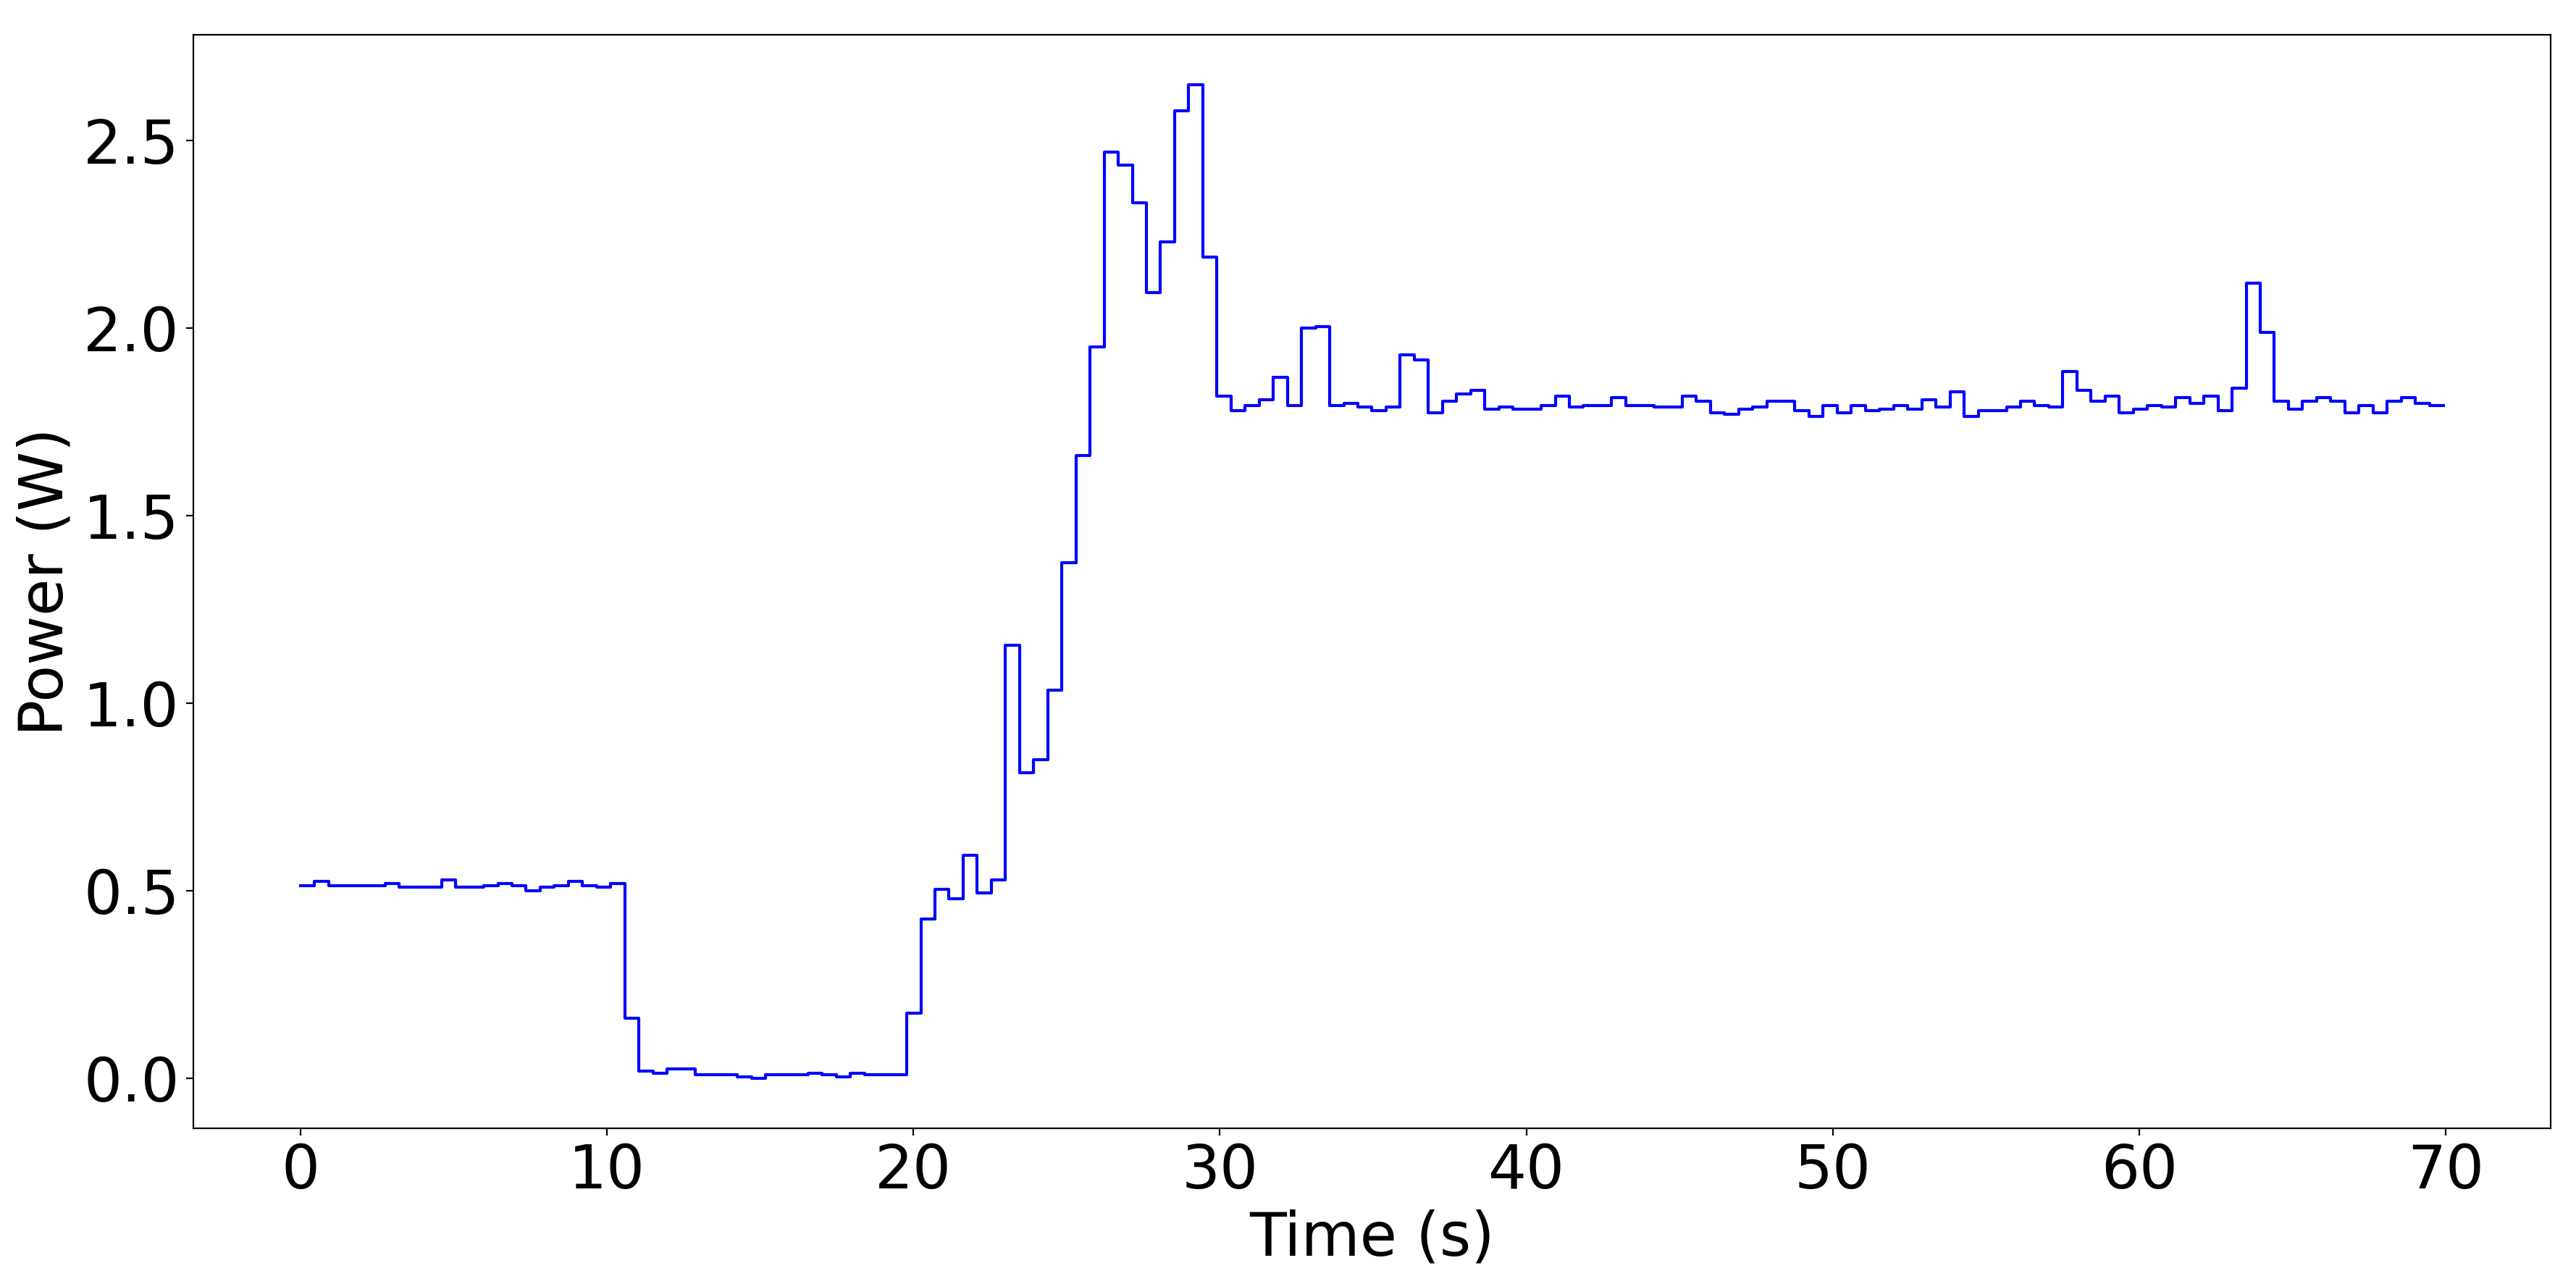
Figure 4: Power consumption of the full setup (Arduino plugged in) during boot up.
Stress Testing
Stress tests are conducted to gauge system performance under maximum computational load. Two types of computational tasks, stress and CPU burn, are employed to push the Raspberry Pi to its limits.
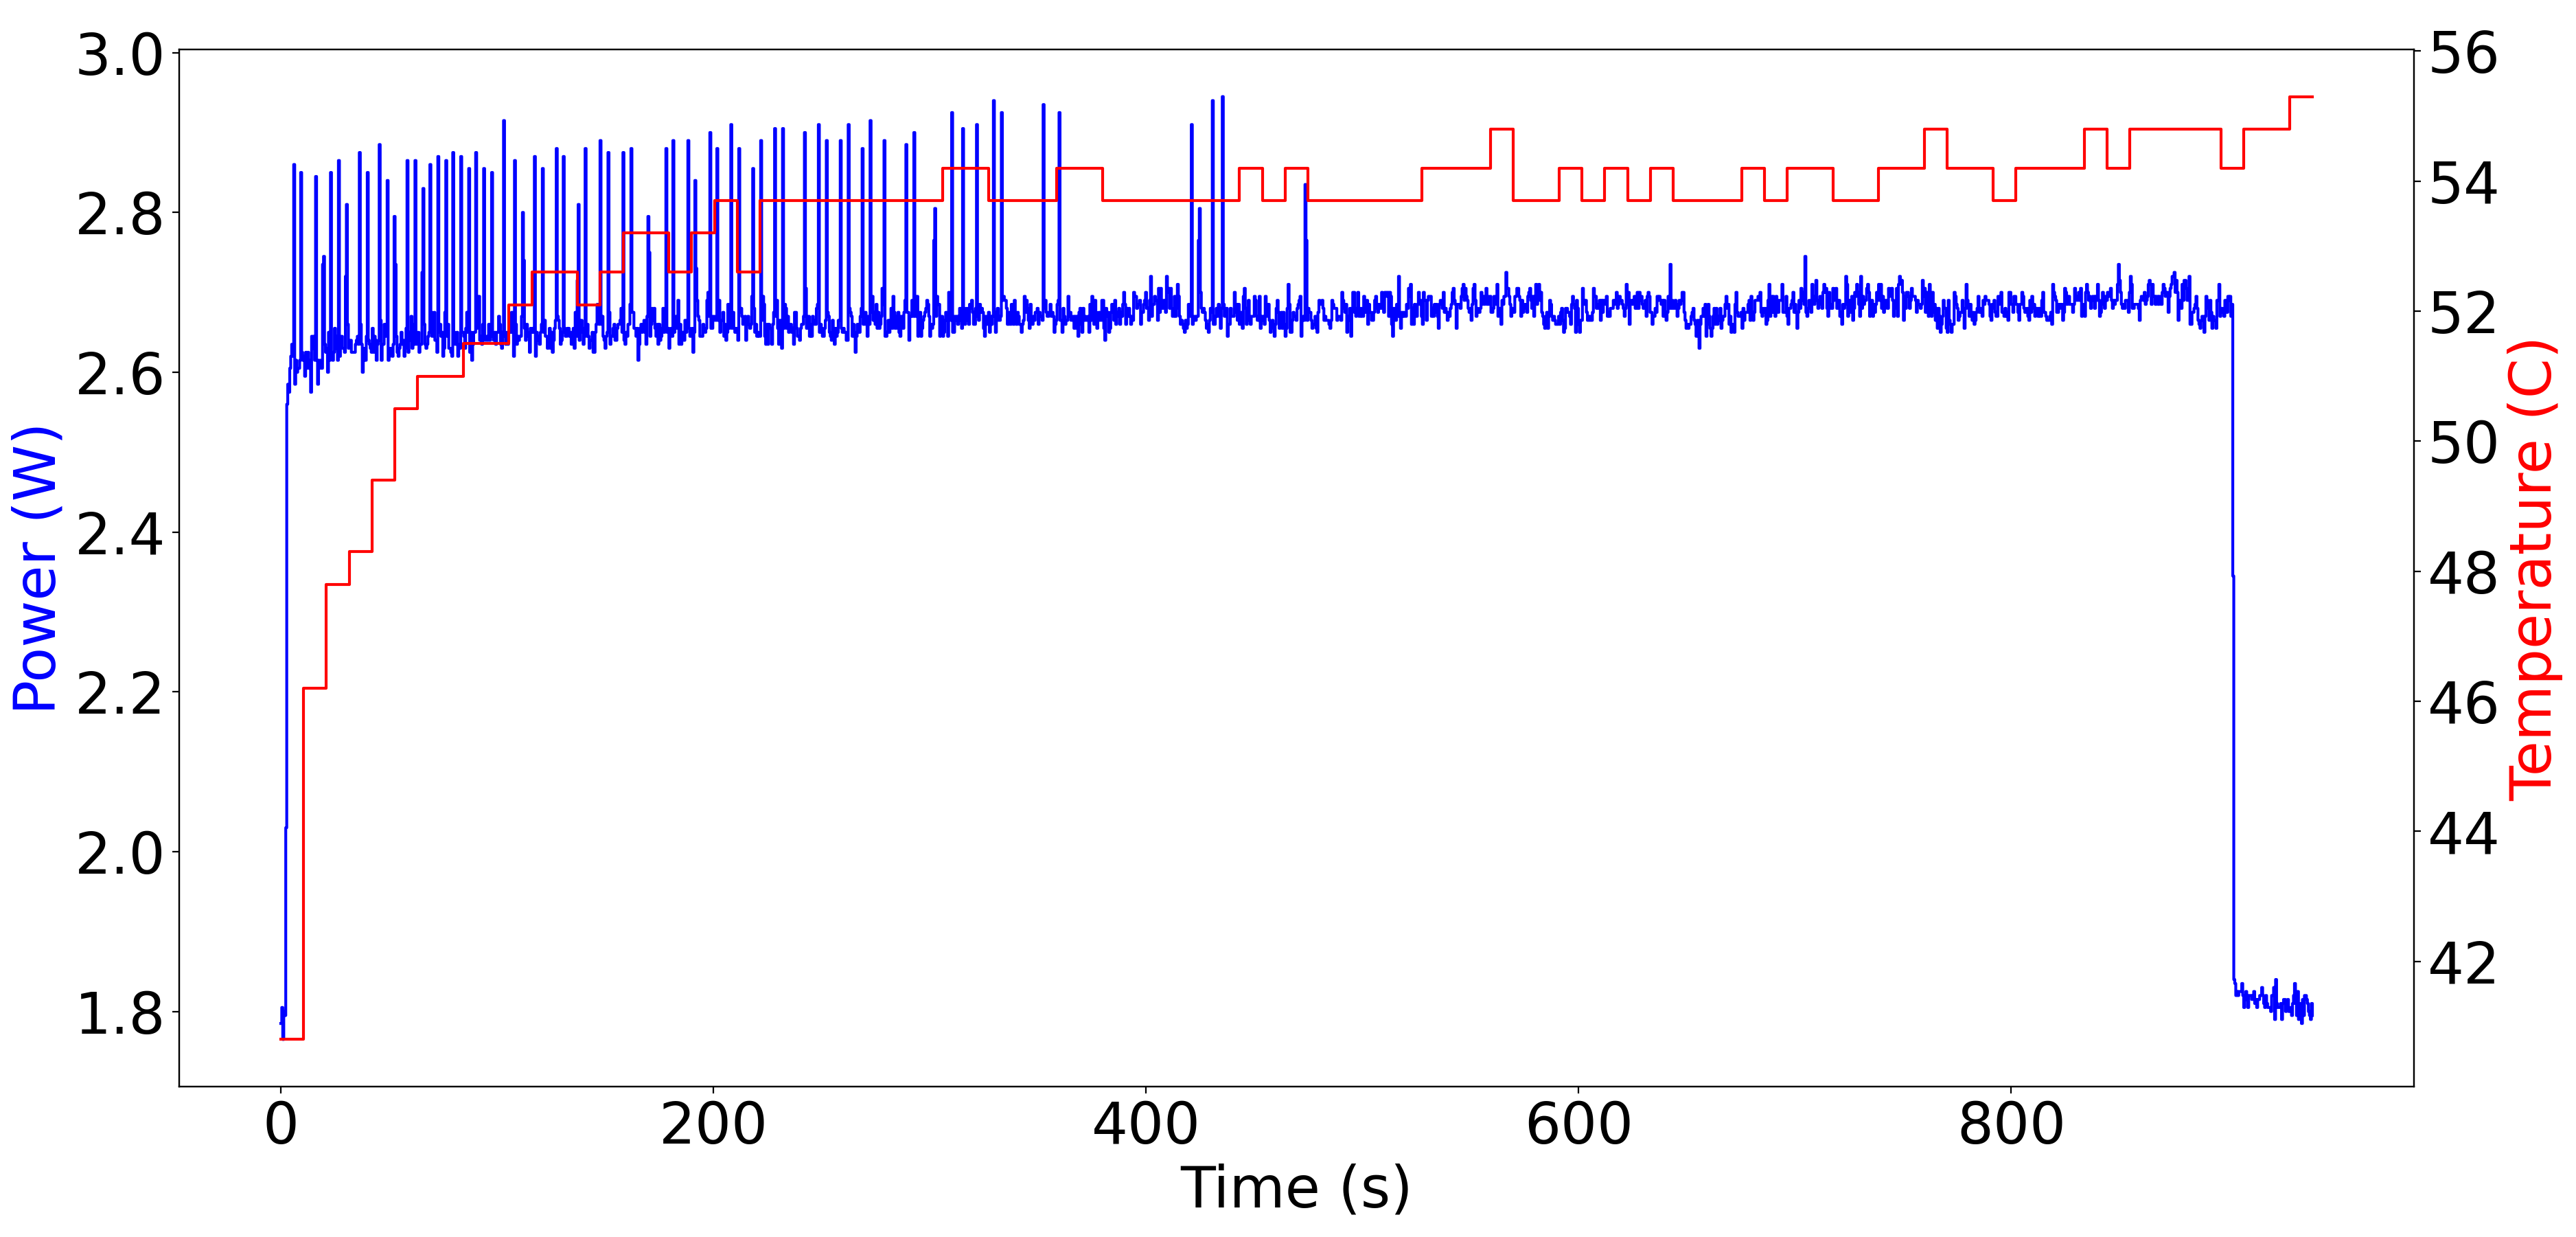
Figure 5: Power consumption of stress task.
These benchmarks establish thresholds for power usage, informing design constraints for peak load conditions.
Results of Beekeeping Tasks
The power profile during typical data acquisition tasks illustrates the sequential energy demands associated with sensor data collection, image capturing, and data transmission.
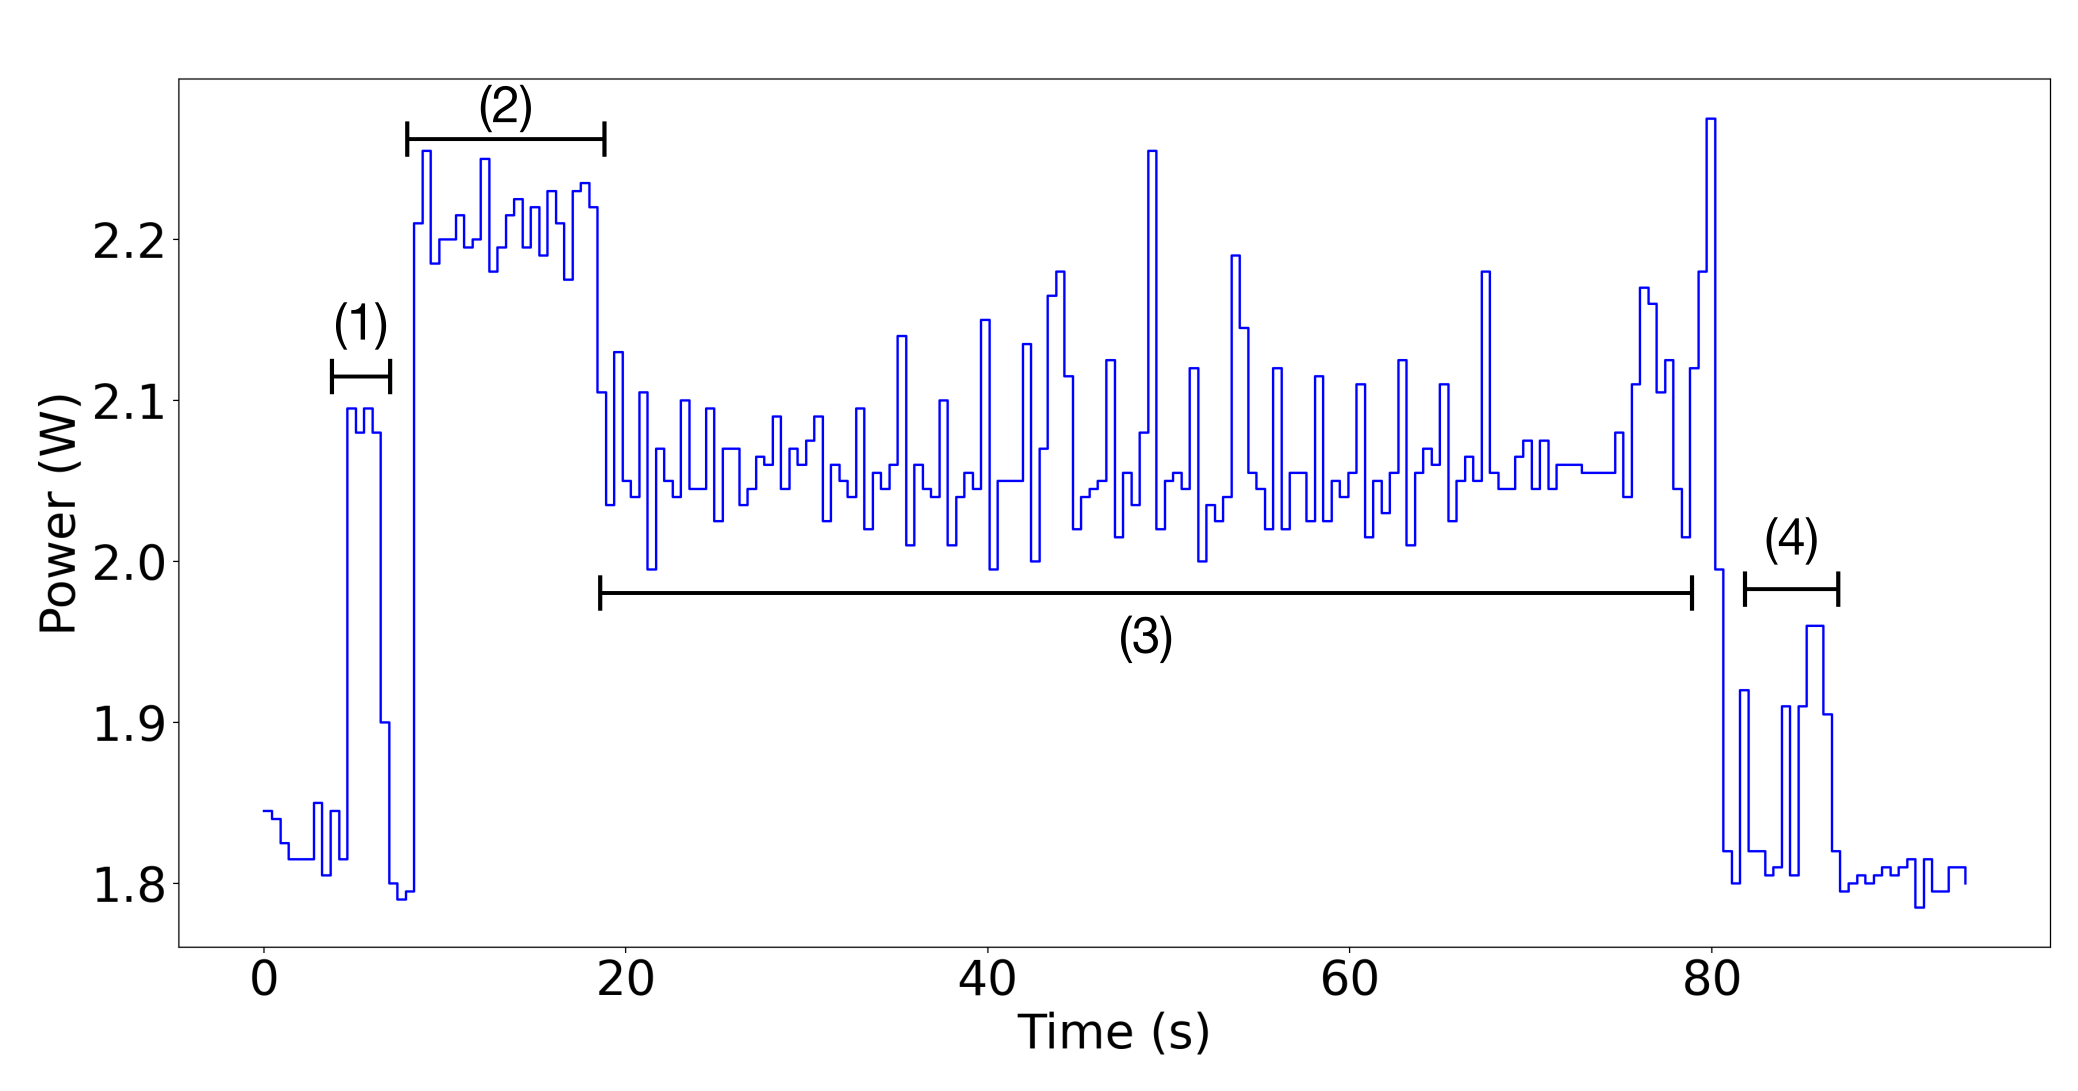
Figure 6: Power usage graph of one execution of the in-hive script.
Analysis shows image processing as the most energy-intensive stage. Optimization strategies under discussion aim at balancing energy consumption with data fidelity.
Network tests reveal disparities between wired and wireless connections regarding speed and energy efficiency. Ethernet connections demonstrate significantly lower energy consumption, suggesting preferences for data transmission paths.
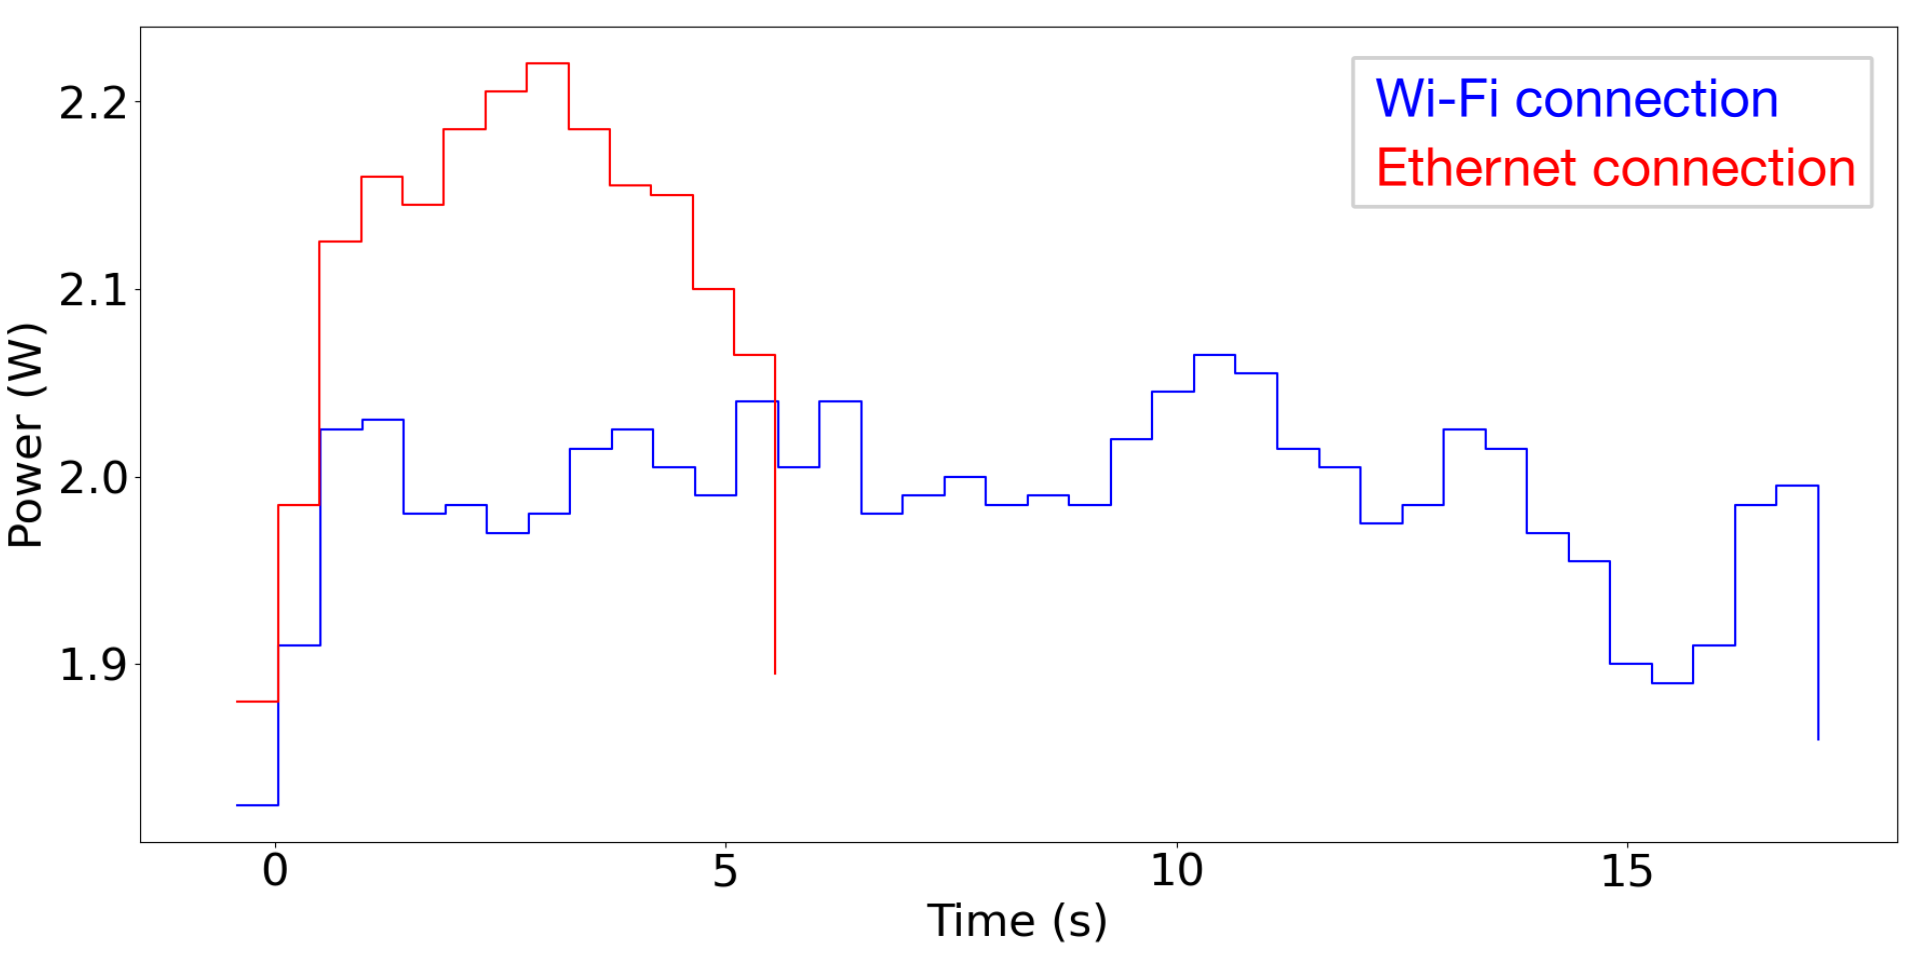
Figure 7: Power consumption of the full setup downloading 50MB from a distant server. Two types of connectivity were tested: Wi-Fi (blue) and ethernet (red).
Furthermore, the thermal performance analysis indicates minimal impact of ambient temperature variations on energy consumption, reinforcing the system's robustness in diverse operational environments.
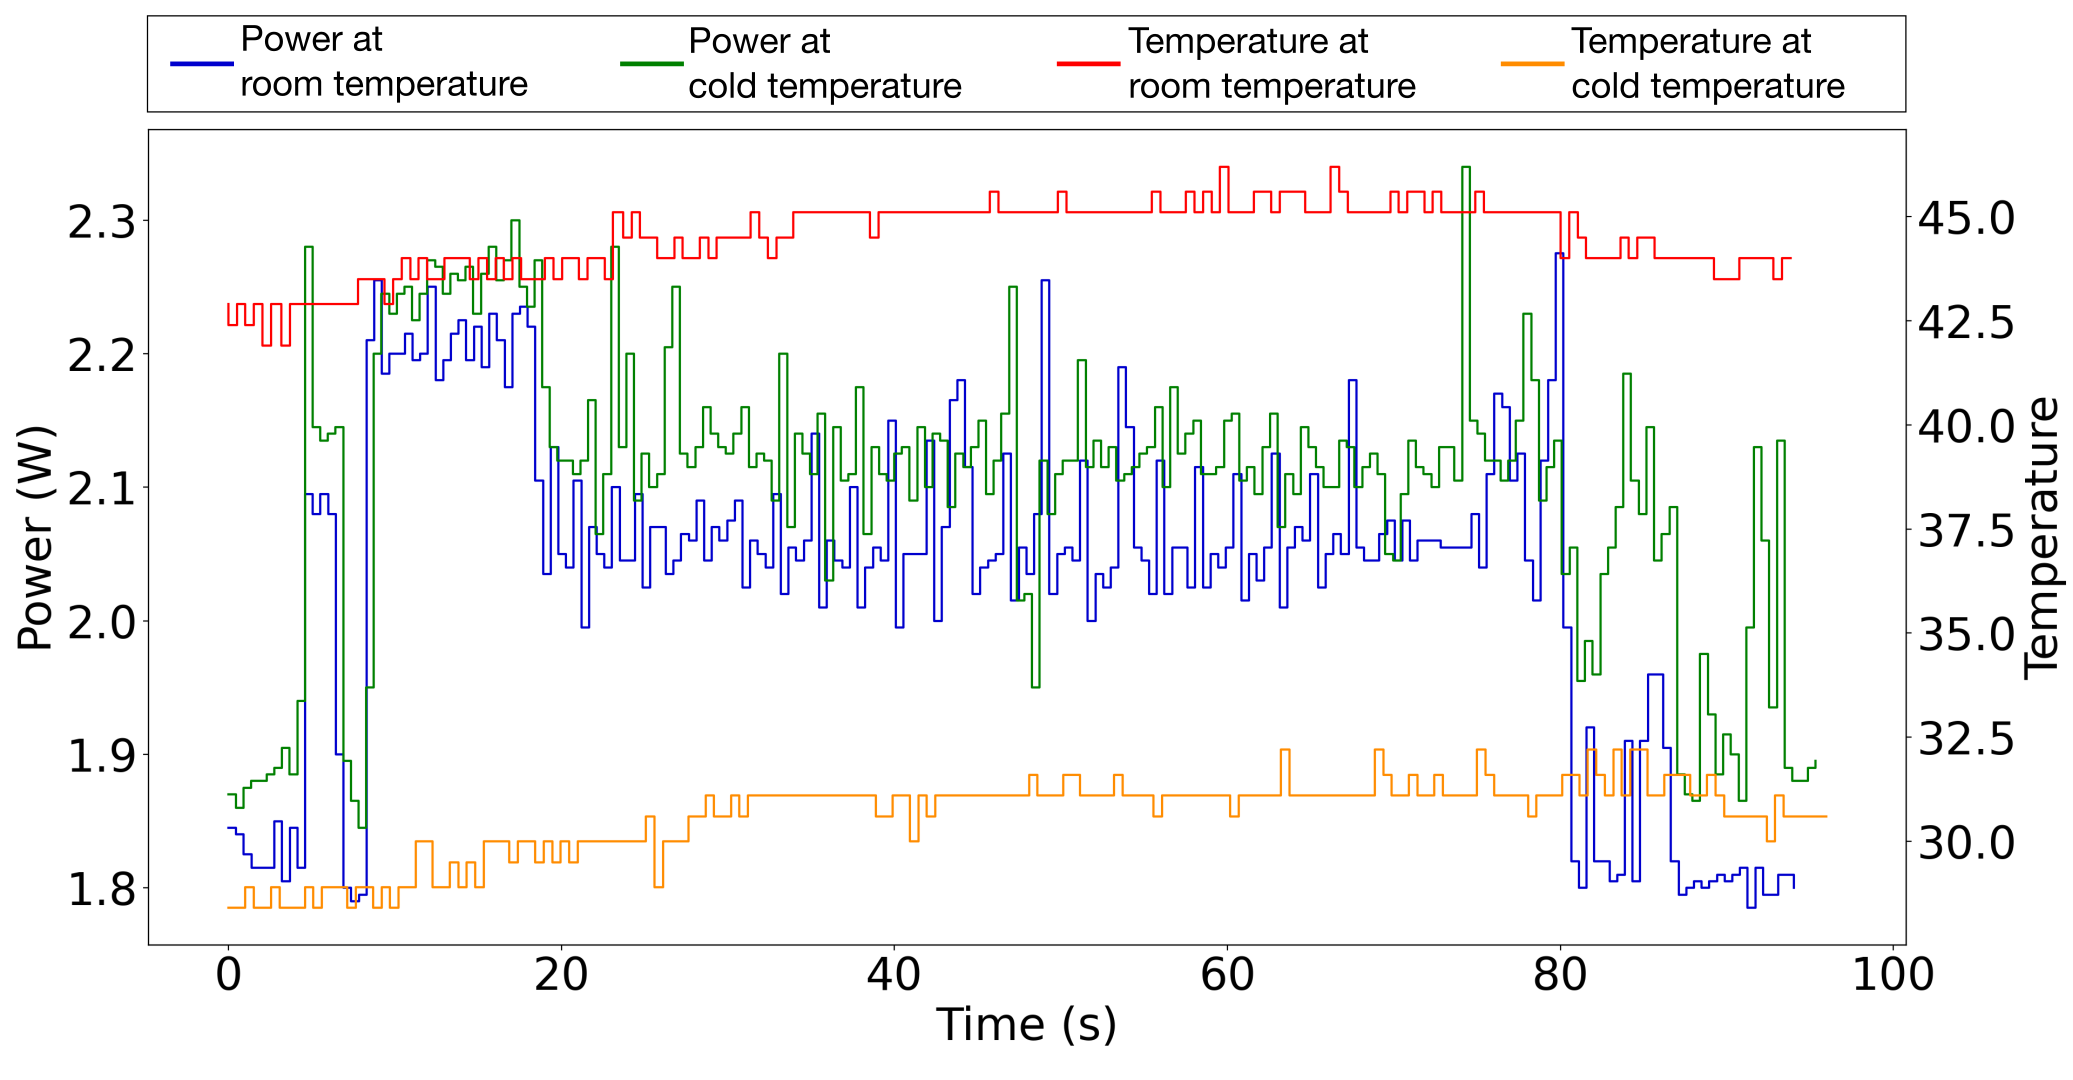
Figure 8: Power usage and temperature of the Raspberry Pi chip for one script run at different temperature conditions.
Conclusion
This investigation into energy usage patterns in precision beekeeping systems showcases the importance of detailed energy profiling for ensuring self-sufficiency and sustainability. Future efforts will explore the incorporation of advanced data processing techniques, such as on-chip deep learning models, while maintaining energy efficiency. This work sets the foundation for developing more refined methods of integrating large-scale IoT systems in agriculture with minimized environmental impact.