A brass Kelvin tide predictor sums ten cosines with one wire and a pen.
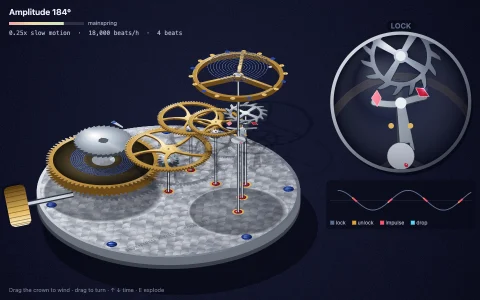
Lord Kelvin's 1872 machine treated the tide as a sum of cosines, one per astronomical constituent, and added them mechanically. Here ten brass wheels turn at the true constituent speeds (M2 every 12.42 hours, S2 every 12, K1 and O1 about once a day, and so on), each driving a Scotch yoke so its pulley moves by exactly A cos(speed t + phase). A single wire, drawn along its true path of tangents and arcs, runs under every moving pulley and over a fixed idler between them, so the pen at its free end moves by the sum of all of them. Over a fortnight M2 and S2 drift in and out of step, and the paper shows the beat as spring and neap tides, marked in red pencil while a little engraved harbour rises and falls with the prediction.
Try it. Click a wheel to disengage or engage its constituent, or drag it up or down to change its amplitude. Hover one to see its own cosine on the paper. Drag across the paper or cabinet to turn the hand crank faster, use the arrow keys for speed, 1 to 0 to toggle constituents, Space to pause and R to restore everything. Left alone, it takes S2 out to show the spring-neap beat disappear, then puts it back.
Paste this into Claude Code, Codex or any coding agent to get a simple version running, then take it wherever you like.
Build a tide-predicting machine in the spirit of Lord Kelvin's with JavaScript and the HTML canvas element. Put everything in a single index.html file with no libraries or build step, so I can open it directly in a browser.

Start simple:
- Make a canvas that fills the window, stays sharp on high-DPI screens (scale by devicePixelRatio), and resizes with the window.
- Define tidal constituents with their real speeds in degrees per hour and made-up amplitudes and phases: M2 28.984 (1.2 m), S2 30.0 (0.42 m), N2 28.440 (0.24 m), K1 15.041 (0.38 m) and O1 13.943 (0.27 m).
- Keep a clock in hours that runs at about 5 hours per second. The tide is the sum of amplitude times cos(speed times t plus phase) over all constituents.
- Draw a scrolling paper strip: a pen sits near the right edge at the current tide height, and the curve of past values scrolls left. Prefill about three weeks so the paper is full from the start.

Once that works, make it a machine:
- Draw a row of wheels, one per constituent, turning at its speed, with a crank pin at a radius equal to its amplitude. Under each wheel hang a pulley whose height follows the pin (a Scotch yoke).
- Thread one wire from an anchor under each moving pulley and over a fixed pulley between each pair, then down to the pen, so it is clear the wire adds the displacements.
- Let me click a wheel to switch its constituent off and on, and mark spring and neap tides on the paper where M2 and S2 are in and out of step.

Explain the key ideas in short code comments. When you're done, tell me how to open it and suggest three directions I could take it next, such as drawing the wire along true tangents between pulleys, a little harbour scene that rises and falls with the prediction, or fitting amplitudes and phases to real tide gauge data with least squares.