A tiny neural network learns to classify points, live, in your browser.
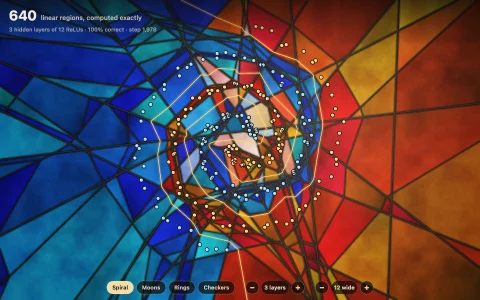
A small multilayer perceptron written from scratch, with no libraries, trains by backpropagation every frame on a two-class dataset such as a spiral or two moons. The background shows its decision boundary, recomputed on a grid each frame, so you can watch the boundary fold and twist as the network learns. A side panel draws the network itself, with each weight shown as a line whose thickness and color follow its value.
Try it. Click to add points of one class and Shift-click (or right-click) for the other. Press 1 to 4 or click the dataset chips to switch datasets, or R to reset the weights.
Paste this into Claude Code, Codex or any coding agent to get a simple version running, then take it wherever you like.
Build a tiny neural network that learns to classify points, live, with JavaScript and the HTML canvas element. Write the network yourself with no machine learning libraries. Put everything in a single index.html file with no libraries or build step, so I can open it directly in a browser.

Start simple:
- Make a canvas that fills the window, stays sharp on high-DPI screens (scale by devicePixelRatio), and resizes with the window. Use a dark background.
- Generate a two-class dataset in the square from -1 to 1: two interleaved spiral arms of about 120 points each, with a little noise.
- Write a multilayer perceptron with 2 inputs, two hidden layers of 8 tanh neurons, and one sigmoid output. Store the weights in typed arrays and initialize them with small random values scaled by 1 / sqrt(fan in).
- Train it with backpropagation on binary cross-entropy. Each animation frame, take a few full-batch gradient steps using the Adam optimizer.
- Draw the decision boundary: evaluate the network on a coarse grid (one sample every 4 to 6 pixels) into a small offscreen canvas with ImageData, then drawImage it scaled up to fill the screen. Color each sample orange or blue by class, stronger where the network is confident.
- Draw the data points on top with a thin white outline, and show the loss and accuracy in a corner.

Once that works, make it beautiful:
- Trace the 0.5 contour with marching squares as a crisp white line.
- Draw the network in a side panel: neurons as small squares, weights as curves whose thickness and color follow their value.
- Add more datasets (two moons, circles, a checkerboard) on the number keys, R to reset the weights, and click to add points.

Explain the key ideas in short code comments. When you're done, tell me how to open it and suggest three directions I could take it next, such as showing each hidden neuron's response as a tiny heatmap, plotting the loss curve over time, or comparing ReLU with tanh.