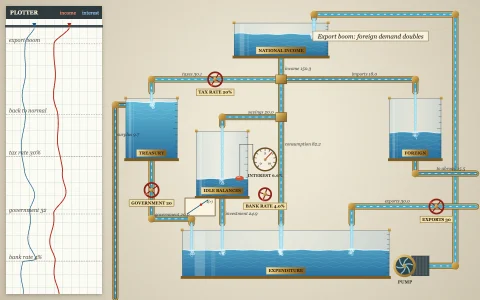
Water fills a hand-drawn pipe network until the minimum cut lights up in red.
Every pipe is an edge whose drawn width is its capacity, and blue water fills it in proportion to flow over capacity. Edmonds-Karp runs a breadth-first search in the residual network (the orange pencil wave), pushes the bottleneck amount along the shortest augmenting path, and repeats; Dinic instead builds a level graph and saturates it with a blocking flow. When the sink can no longer be reached, the nodes the search did reach form one side of a minimum cut. A dashed red line is traced between the two sides as a marching-squares contour of a signed distance field, so it crosses exactly the saturated pipes, and their capacities add up to the max flow: the max-flow min-cut theorem, drawn.
Try it. Drag a pipe up or down to change its capacity, click a pipe to cut or mend it, drag junctions around, and click empty paper to add a junction. The flow reroutes from where it is, cancelling any excess first. Switch between Edmonds-Karp and Dinic (A), pause (Space) or draw a new network (R). Left alone, it keeps widening bottlenecks and breaking pipes so the cut moves.
Edmonds-Karp and Dinic as step generators
Residual graphs and flow cancellation
Min-cut contour via marching squares on a signed distance field
Paste this into Claude Code, Codex or any coding agent to get a simple version running, then take it wherever you like.
Build an animated max-flow visualizer with JavaScript and the HTML canvas element, where water flows through a network of pipes. Put everything in a single index.html file with no libraries or build step.

Start simple:
- Make a canvas that fills the window, stays sharp on high-DPI screens (scale by devicePixelRatio), and resizes with the window. Paint it a warm paper color.
- Hard-code a small network: a source on the left, a sink on the right and about eight junctions in between, joined by twelve or so undirected pipes, each with an integer capacity from 1 to 10.
- Draw each pipe as a thick band whose width is proportional to its capacity, with dark outline walls, and draw the junctions as circles.
- Implement Edmonds-Karp: a breadth-first search in the residual network (room is cap - flow one way and cap + flow the other), then push the bottleneck amount along the path it found. Repeat until the sink cannot be reached.
- Animate it: highlight each augmenting path for a moment, then increase the flows.
- Fill each pipe with a blue band whose width is its flow / capacity, with a small 'flow/capacity' label.

Once that works, make it beautiful:
- When no augmenting path is left, the nodes the last search reached are the source side of a minimum cut. Mark the pipes between the two sides in red and show that their capacities add up to the total flow.
- Give the water life with moving dashes along each pipe in the direction of flow, easing drawn flows toward new values.
- Make it hand-drawn: wobble the walls slightly with fixed random offsets and draw a faint grid on the paper.
- Let me click a pipe to cut it, then rerun the search from zero.

Explain the key ideas in short code comments. When you're done, tell me how to open it and suggest three directions I could take it next, such as Dinic's level graph and blocking flows, drawing the cut as a smooth curve between the two sides, or letting me drag pipe widths and watch the flow reroute.