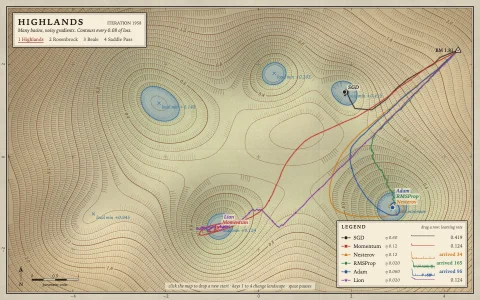
An evolution strategy's search ellipse stretches, turns and collapses onto the optimum.
CMA-ES keeps a Gaussian search distribution, drawn here as a real density glow: a radial gradient transformed by the square root of the covariance matrix. Each generation it samples a population, ranks the samples by loss and moves the mean to a weighted average of the best half. An evolution path of recent steps stretches the covariance along directions that keep paying off (the pink arrow), the spread of the winners adds a rank-mu update, and a second path compares its length with a random walk to grow or shrink the step size. On Rastrigin, Ackley, a tilted trough and Rosenbrock's banana you can watch the ellipse align with valleys and shrink by six orders of magnitude, followed by a loupe that zooms with it, while random search with the same budget stalls; when it converges in a local minimum it restarts with twice the population (IPOP).
Try it. Click anywhere on the map to start a new search there. Pick a function with the chips or keys 1 to 4. Toggle random search with its button or R, and press the left and right arrows to change speed. Space pauses.
Paste this into Claude Code, Codex or any coding agent to get a simple version running, then take it wherever you like.
Build a visualization of the CMA-ES optimizer searching a 2D function, using JavaScript and the HTML canvas element. Put everything in a single index.html file with no libraries or build step, so I can open it directly in a browser.

Start simple:
- Make a canvas that fills the window, stays sharp on high-DPI screens (scale by devicePixelRatio), and resizes with the window.
- Render the Rastrigin function f(x, y) = 20 + x^2 - 10 cos(2 pi x) + y^2 - 10 cos(2 pi y) over [-5.12, 5.12] squared as a heatmap into an offscreen canvas at half resolution, coloring log(1 + f) with a dark palette where low values glow.
- Implement CMA-ES for two dimensions following Hansen's tutorial: a mean m, a step size sigma, a 2x2 covariance C, the evolution paths p_c and p_sigma, recombination weights for the best half, and the rank-one and rank-mu updates. The eigen decomposition of a 2x2 symmetric matrix has a closed form.
- Run one generation every half second: draw the samples as dots, color the selected ones brighter, and draw the 1, 2 and 3 sigma ellipses of the distribution.
- Click to restart the search from that point.

Once that works, make it beautiful:
- Animate each generation: samples fly out of the mean, get ranked, then the ellipse morphs smoothly into the new one (interpolate C and sigma).
- Fill the ellipse with a Gaussian glow by applying the ellipse transform to the context and filling a radial gradient.
- Keep fading ghosts of the last dozen ellipses and draw the evolution path as an arrow from the mean.
- Add a small chart of the best loss and sigma per generation on a log scale.

Explain the key ideas in short code comments. When you're done, tell me how to open it and suggest three directions I could take it next, such as IPOP restarts with a doubling population, a zooming loupe that follows the shrinking ellipse, or racing it against random search.