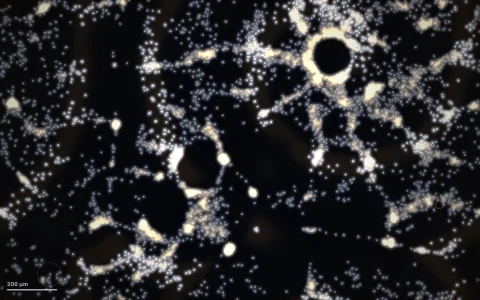
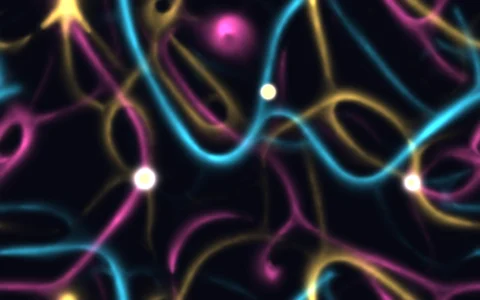
Hundreds of E. coli turn a random walk into a climb up a sugar gradient.
Each bacterium swims in straight runs and stops to tumble when a flagellar motor flips clockwise, and its tumble rate is set by an MWC model of the receptor cluster at its pole: attractant lowers the cluster's kinase activity, less CheY-P reaches the ultrasensitive motors, and runs get longer. Methylation by CheR and CheB slowly returns the activity to its set point, giving each cell a two-second memory, so it compares the present with the recent past instead of measuring the gradient across its body. Runs that happen to point uphill are lengthened, runs pointing down are cut short, and the crowd drifts toward the pipette. Sugar and repellent diffuse on a grid, cells leave darkfield streaks colored by their kinase activity, and one highlighted cell shows its receptor methylation, CheY-P, motor direction and recent history in the inset.
Try it. Click to drop sugar from a pipette (or pick Repellent in the corner; right-click drops the other one), drag to leave a trail of drops, and click a cell to follow it. Press A to switch off adaptation and watch chemotaxis fail, R to swap tools, C to rinse the chamber, and Space to follow another cell.
Paste this into Claude Code, Codex or any coding agent to get a simple version running, then take it wherever you like.
Build an E. coli chemotaxis simulation with JavaScript and the HTML canvas element. Put everything in a single index.html file with no libraries or build step, so I can open it directly in a browser.

Start simple:
- Make a canvas that fills the window, stays sharp on high-DPI screens (scale by devicePixelRatio), and resizes with the window. Paint it black, like a darkfield microscope.
- Create about 400 bacteria at random positions. Each one runs straight at a constant speed with a little rotational jitter, and at random moments tumbles: it stops for a fraction of a second and turns to a new direction, about 70 degrees on average.
- Keep a sugar concentration on a coarse grid. Clicking adds a source that keeps releasing sugar, and each frame the grid diffuses (a simple 5-point stencil) and slowly decays.
- Give every cell a memory. Store a methylation level m and compute the receptor activity a = 1 / (1 + exp(N * (1 - m / 2 + ln((1 + c / Ki) / (1 + c / Ka))))) with N = 6, Ki = 18 and Ka = 3000 in the same units as c. Let m drift so that a returns to about one third over a couple of seconds, and set the tumble rate to roughly (a / 0.33) to the power 5 per second. Runs up the gradient will last longer, and the crowd will drift toward the sugar.

Once that works, make it beautiful:
- Draw the cells as short glowing rods with additive blending, and keep a ring buffer of each cell's recent positions to draw fading streaks.
- Color each cell by its activity: cyan when things are getting better, orange when they are getting worse.
- Highlight one cell and plot its sugar, methylation and activity over the last 20 seconds in a small panel.

Explain the key ideas in short code comments. When you're done, tell me how to open it and suggest three directions I could take it next, such as repellents, a mutant with adaptation switched off, or a capillary assay.