- The paper introduces a novel framework that fuses Fuzzy C-Means clustering with CEFR-based ordinal mapping to automate assessment in Scratch.
- It leverages data from over two million Scratch projects and nine computational thinking features to identify clear and transitional learner profiles.
- The methodology demonstrates high generalizability and provides adaptive curriculum design insights through continuous progress tracking and certainty quantification.
A Fuzzy C-Means and CEFR-Aligned Framework for Automated Programming Skill Assessment in Scratch
Introduction and Motivation
This work presents a comprehensive, data-driven framework for scalable programming skill assessment in block-based learning environments, specifically Scratch. The approach fuses Fuzzy C-Means (FCM) clustering with the Common European Framework of Reference (CEFR) proficiency scale, enabling a pedagogically aligned, ordinal classification of computational thinking (CT) competencies. The primary innovation is mapping unsupervised cluster centroids to CEFR levels (A1--C2) via an Sj-ordering criterion, followed by enhanced classification strategies that identify transitional learners, quantify classification certainty, and report continuous progress metrics.
The impetus stems from a convergence of educational needs: scalable yet interpretable skill diagnostics, actionable insights for adaptive curriculum design, support for personalized learning trajectories, and integration within standards-based frameworks such as DigCompEdu. Traditional assessment tools (Dr.Scratch, CTt, Bebras, Hairball, LitterBox) measure discrete CT constructs yet lack holistic, standardized proficiency mappings or nuanced modeling of learner states between categories.
Methodological Framework
Data and Feature Engineering
The empirical base consists of over two million public Scratch projects, automatically mined and assessed via Dr.Scratch, extracting nine ordinal CT features (0--4) per project: Abstraction, Parallelization, Logic, Synchronization, Flow Control, User Interactivity, Data Representation, Math Operators, and Motion Operators. Projects are stratified into training (80%) and test (20%) sets, yielding robust train-test consistency for external validation.
Ordinal Fuzzy Clustering and CEFR Mapping
The FCM algorithm is used (fuzzification m=1.5, ϵ=10−5), producing soft partitioning of projects across k=6 clusters. This enables rich representation of skill gradients, capturing both clear and transitional learner profiles. The novel Sj criterion, defined as the sum over CT centroid values per cluster, imposes a deterministic ordinal mapping onto the categorical FCM outputs, directly aligning clusters to the ascending CEFR sequence.
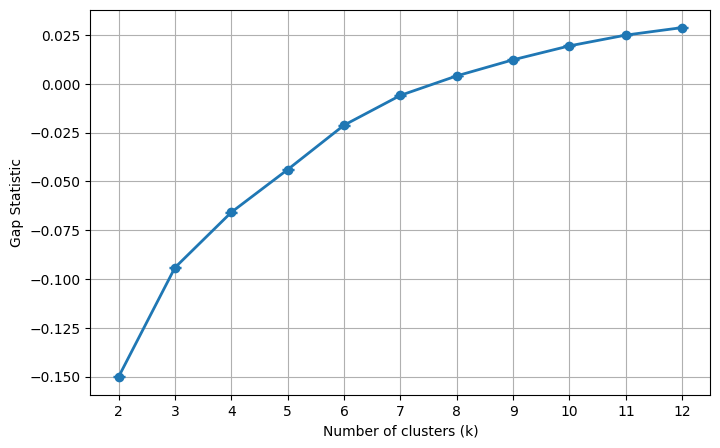
Figure 1: Gap statistic for k=2 to k=12 clusters, confirming non-discrete underlying distributions and justifying domain-prioritized k=6 CEFR alignment.
The rigorous selection of six clusters, rather than the statistically optimal two, is justified by (i) international standardization (CEFR, DigCompEdu), (ii) retention of essential granularity for transition-state detection, and (iii) statistically significant discrimination across all pairs (Kruskal–Wallis, Mann–Whitney p<0.001).
Enhanced Classification and Certainty Quantification
Beyond single-label assignments, the framework introduces three orthogonal metrics:
- Classification Type: "Clear" (primary membership ≥ 0.5), "Transition" (primary-secondary gap m=1.50 0.15), and "Predominant" (all others), allowing for fine-grained differentiation relevant to formative assessment.
- Continuous Score: Membership-weighted average across ordinal CEFR levels, supporting high-resolution progress tracking (m=1.51).
- Certainty: Shannon entropy-derived metric capturing cluster ambiguity, partitioned as Low (m=1.52 0.4), Medium, or High (m=1.53 0.7) to control human-in-the-loop escalation.
Results
Model Generalization and Robustness
The model demonstrates minimal generalization gap: Silhouette scores and Average Certainty remain stable between training and test splits (m=1.54 Silhouette = m=1.55, m=1.56 Certainty = m=1.57), indicating high transferability.
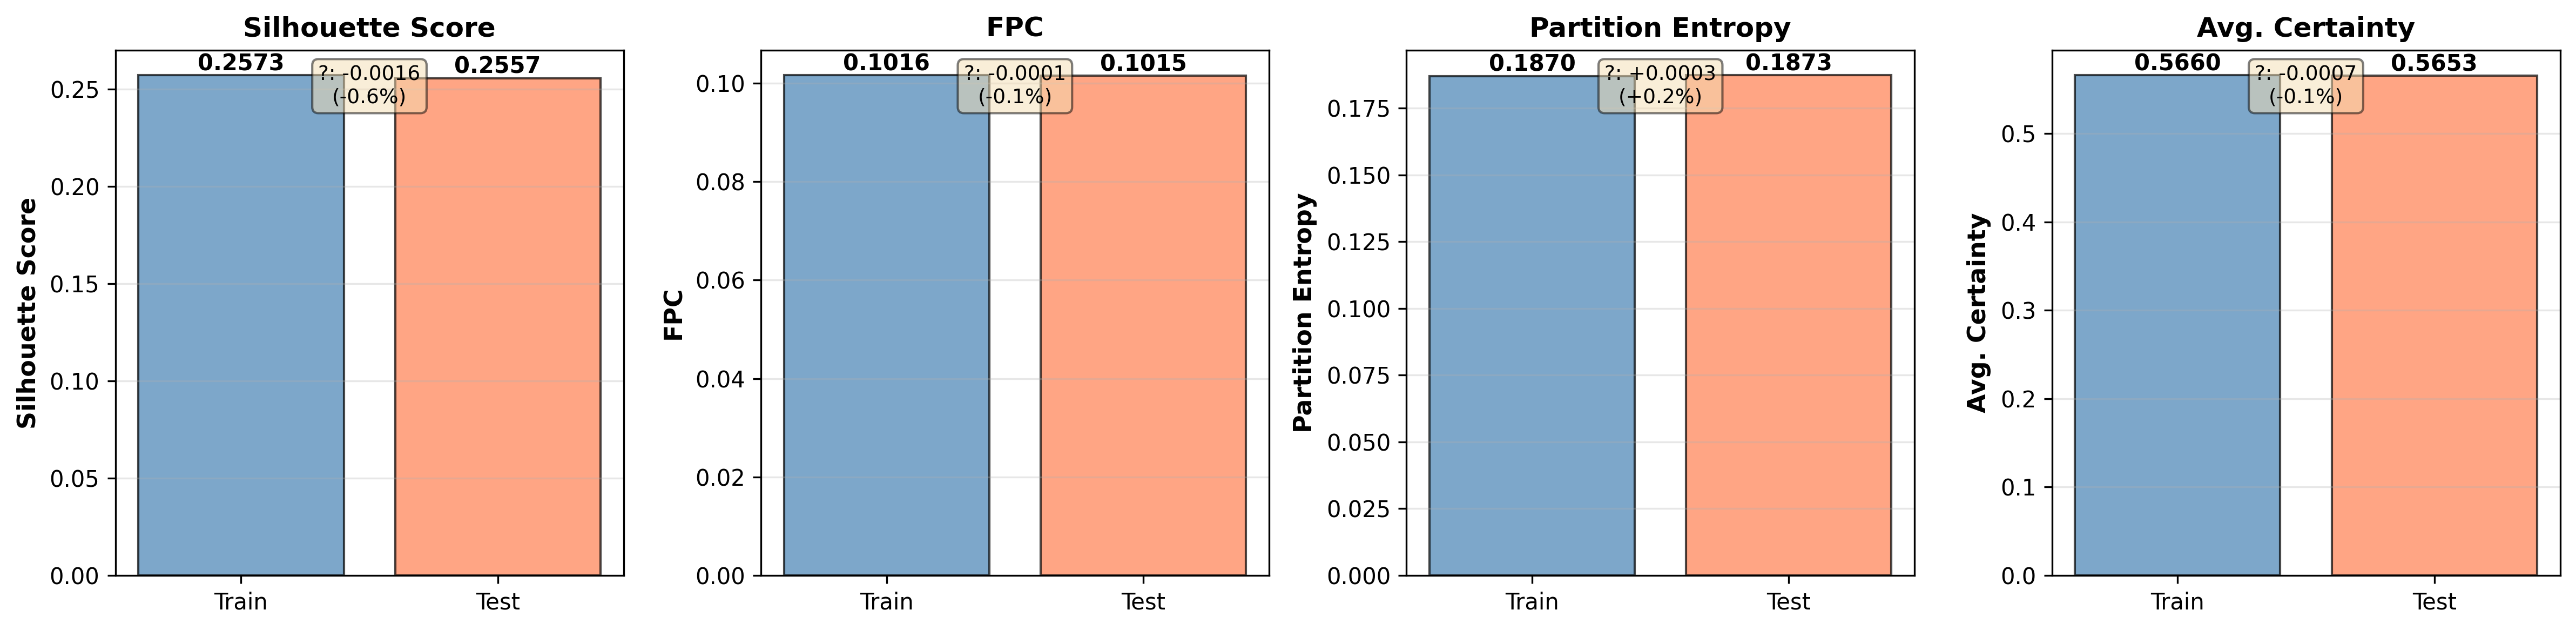
Figure 2: Train-test performance comparison demonstrates generalization stability with negligible degradation across evaluation metrics.
Principal Component Analysis shows substantial overlap between adjacent clusters, confirming the empirical continuum of programming skill acquisition rather than discrete categories.
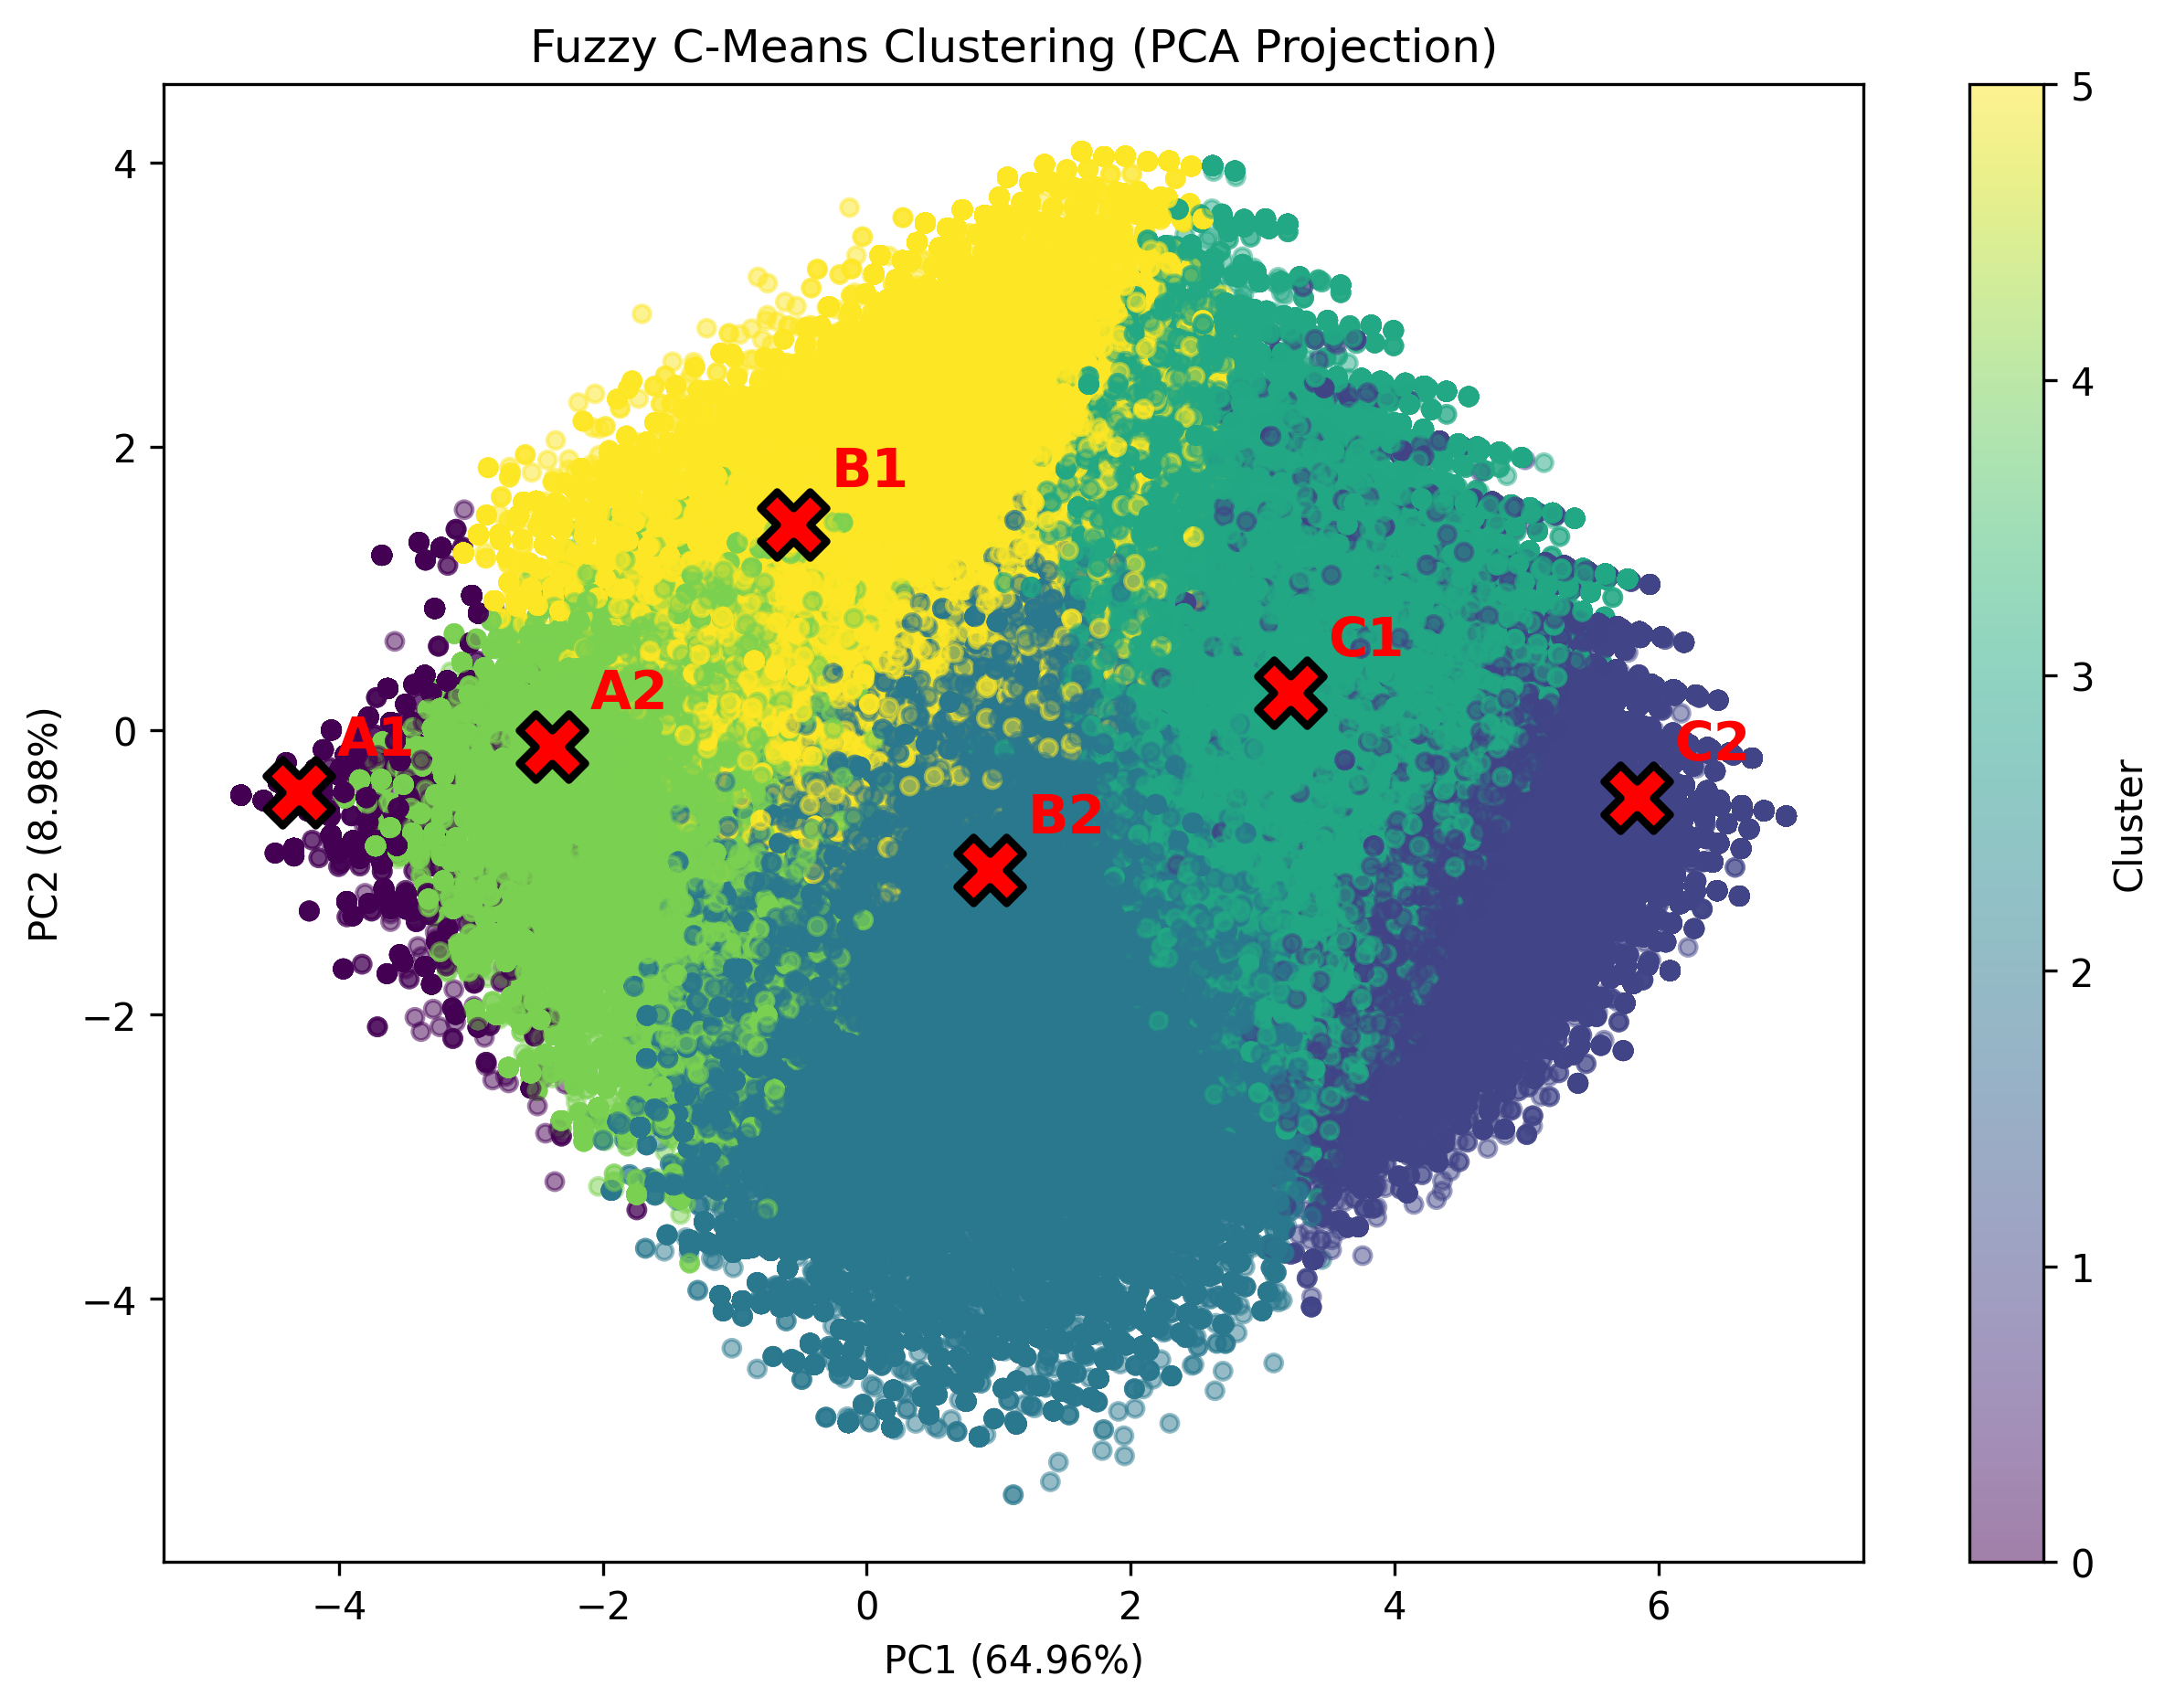
Figure 3: PCA projection of training set observations colored by FCM cluster, centroids ordered by CEFR level, visualizing natural gradation and overlap.
Centroid Profiles and Diagnostic Bottlenecks
Centroid analysis elucidates clear progression across CEFR levels, with low-level clusters characterized by minimal engagement (A1), intermediate clusters showing partial ability across multiple CT facets (B1, B2), and upper clusters (C1, C2) reflecting consistently high scores.
A pronounced "B2 bottleneck" is observed: only 13.3% of learners reach this transitional zone, contrasted by heightened density at A1/A2 (39.3%) and C1/C2 (27.8%). This is further substantiated by dimension-specific rank correlations, with Synchronization, Flow Control, and Logic providing the strongest discriminatory power (m=1.58).
Enhanced Classification in Practice
Test set results distribute as 79.1% "Clear," 13.7% "Transition," and 7.3% "Predominant," recovering the full distributional spread of learner states across the progression spectrum.
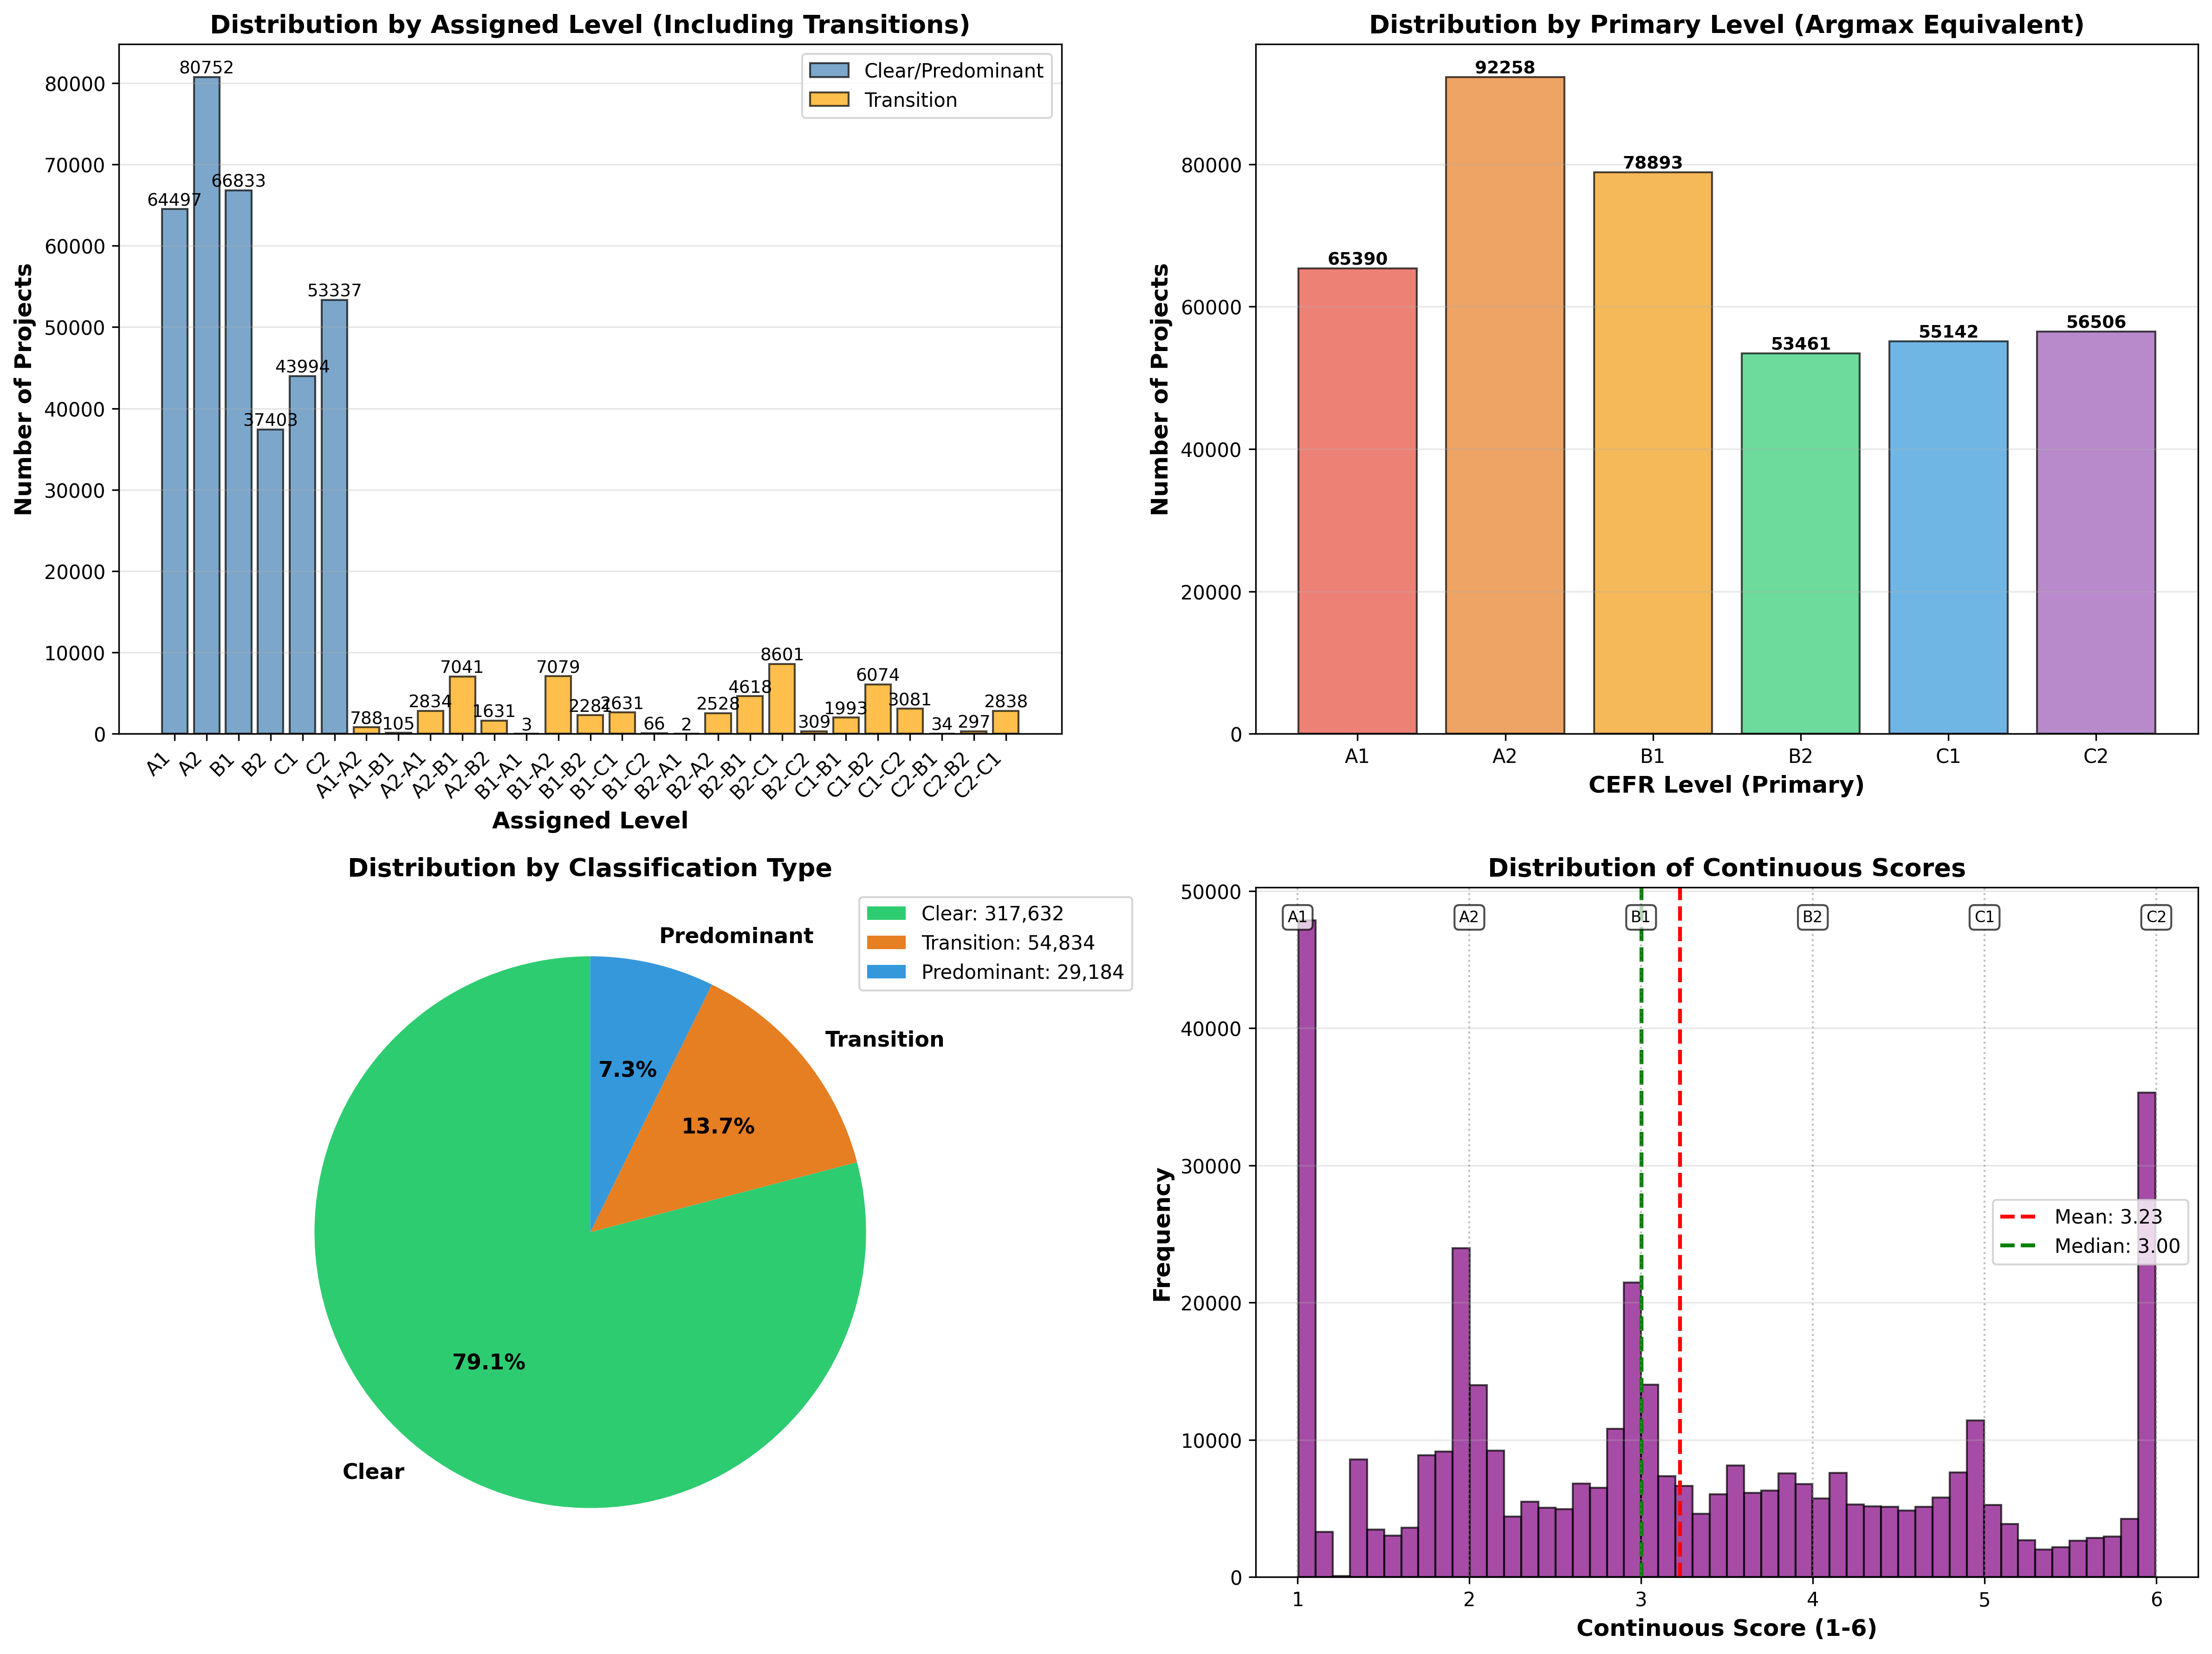
Figure 4: Test set classification distribution across assigned levels, highlighting transition states, and continuous score breakdown with CEFR markers.
Certainty analysis shows a nearly equal partitioning into Low, Medium, and High domains, optimizing for flexible human review scheduling based on resource constraints and pedagogical risk tolerance.
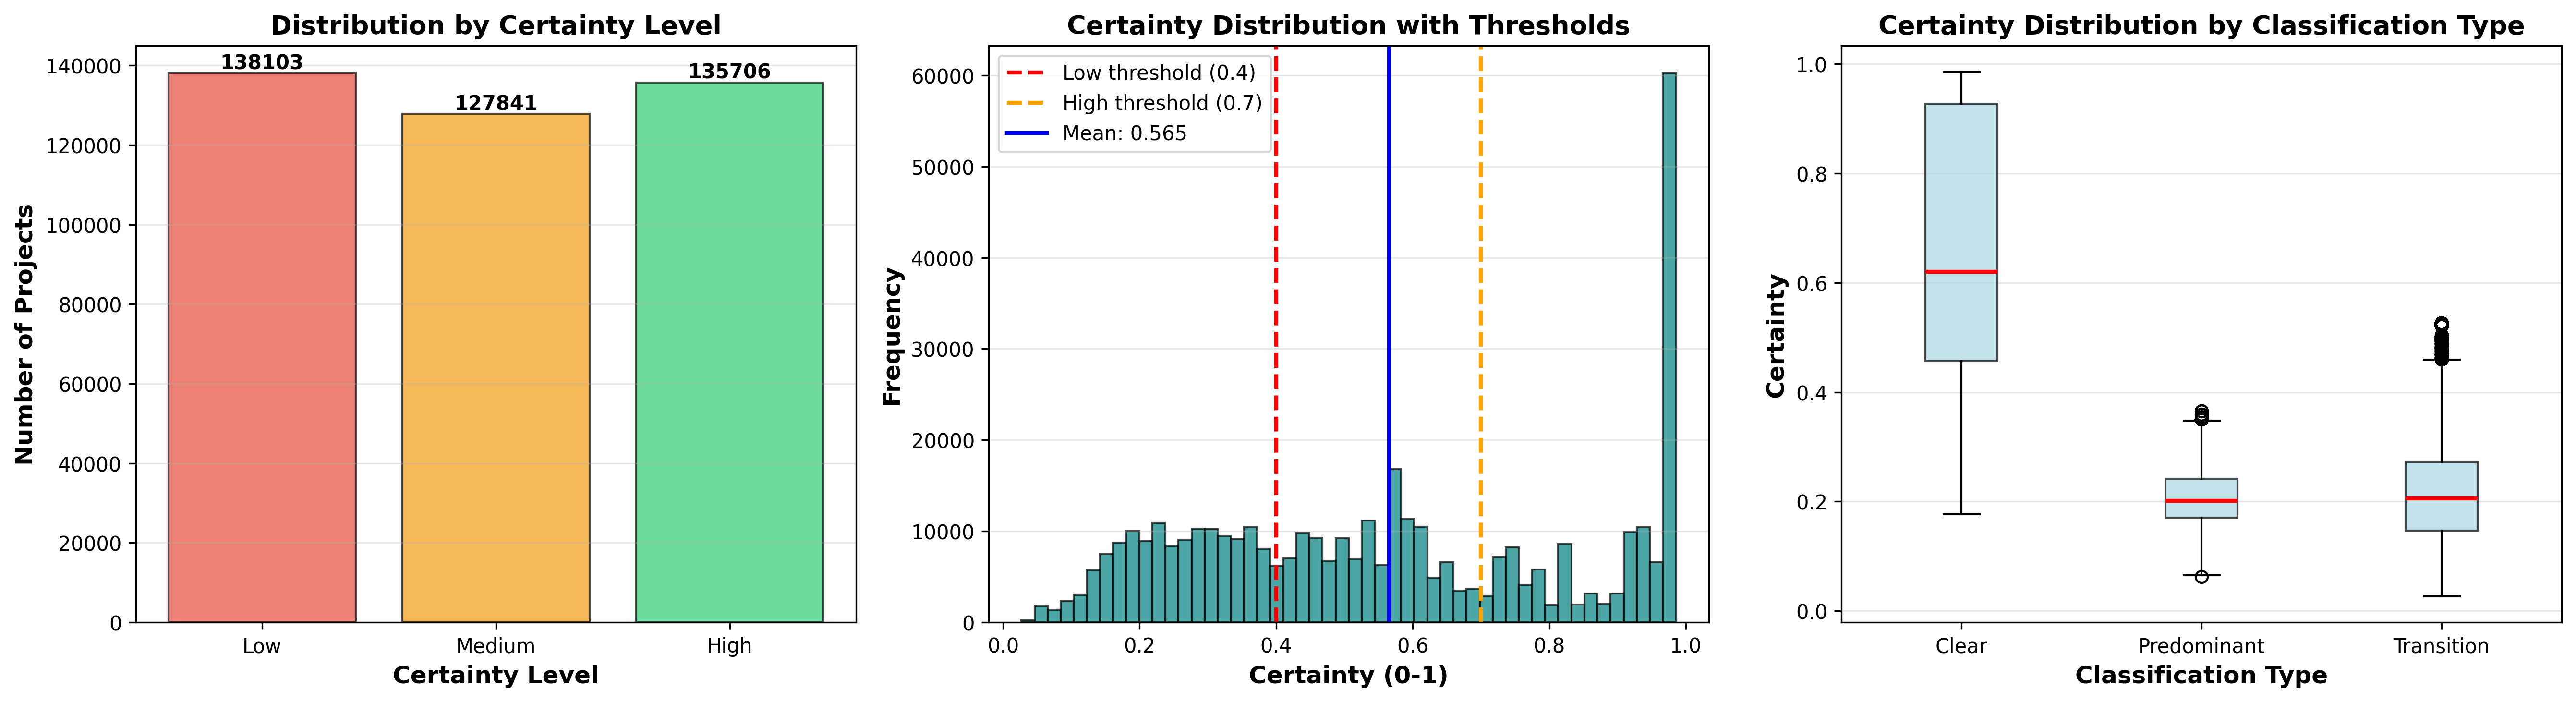
Figure 5: Certainty analysis by categorical certainty level, including continuous score histogram and box plots by classification type.
Representative Learner Profiles
Visualization of prototypical cases demonstrates the model's discriminative capacity. Example profiles include:
- A1 (Clear): Uniformly minimal CT dimensions; membership m=1.59 1.0; certainty 0.99.
- B2–B1 (Transition): Mixed strengths; balanced memberships (B2 ϵ=10−50, B1 ϵ=10−51); certainty ϵ=10−52; continuous score ϵ=10−53.
- C2 (Clear): All dimensions maxed; membership ϵ=10−54; certainty ϵ=10−55.
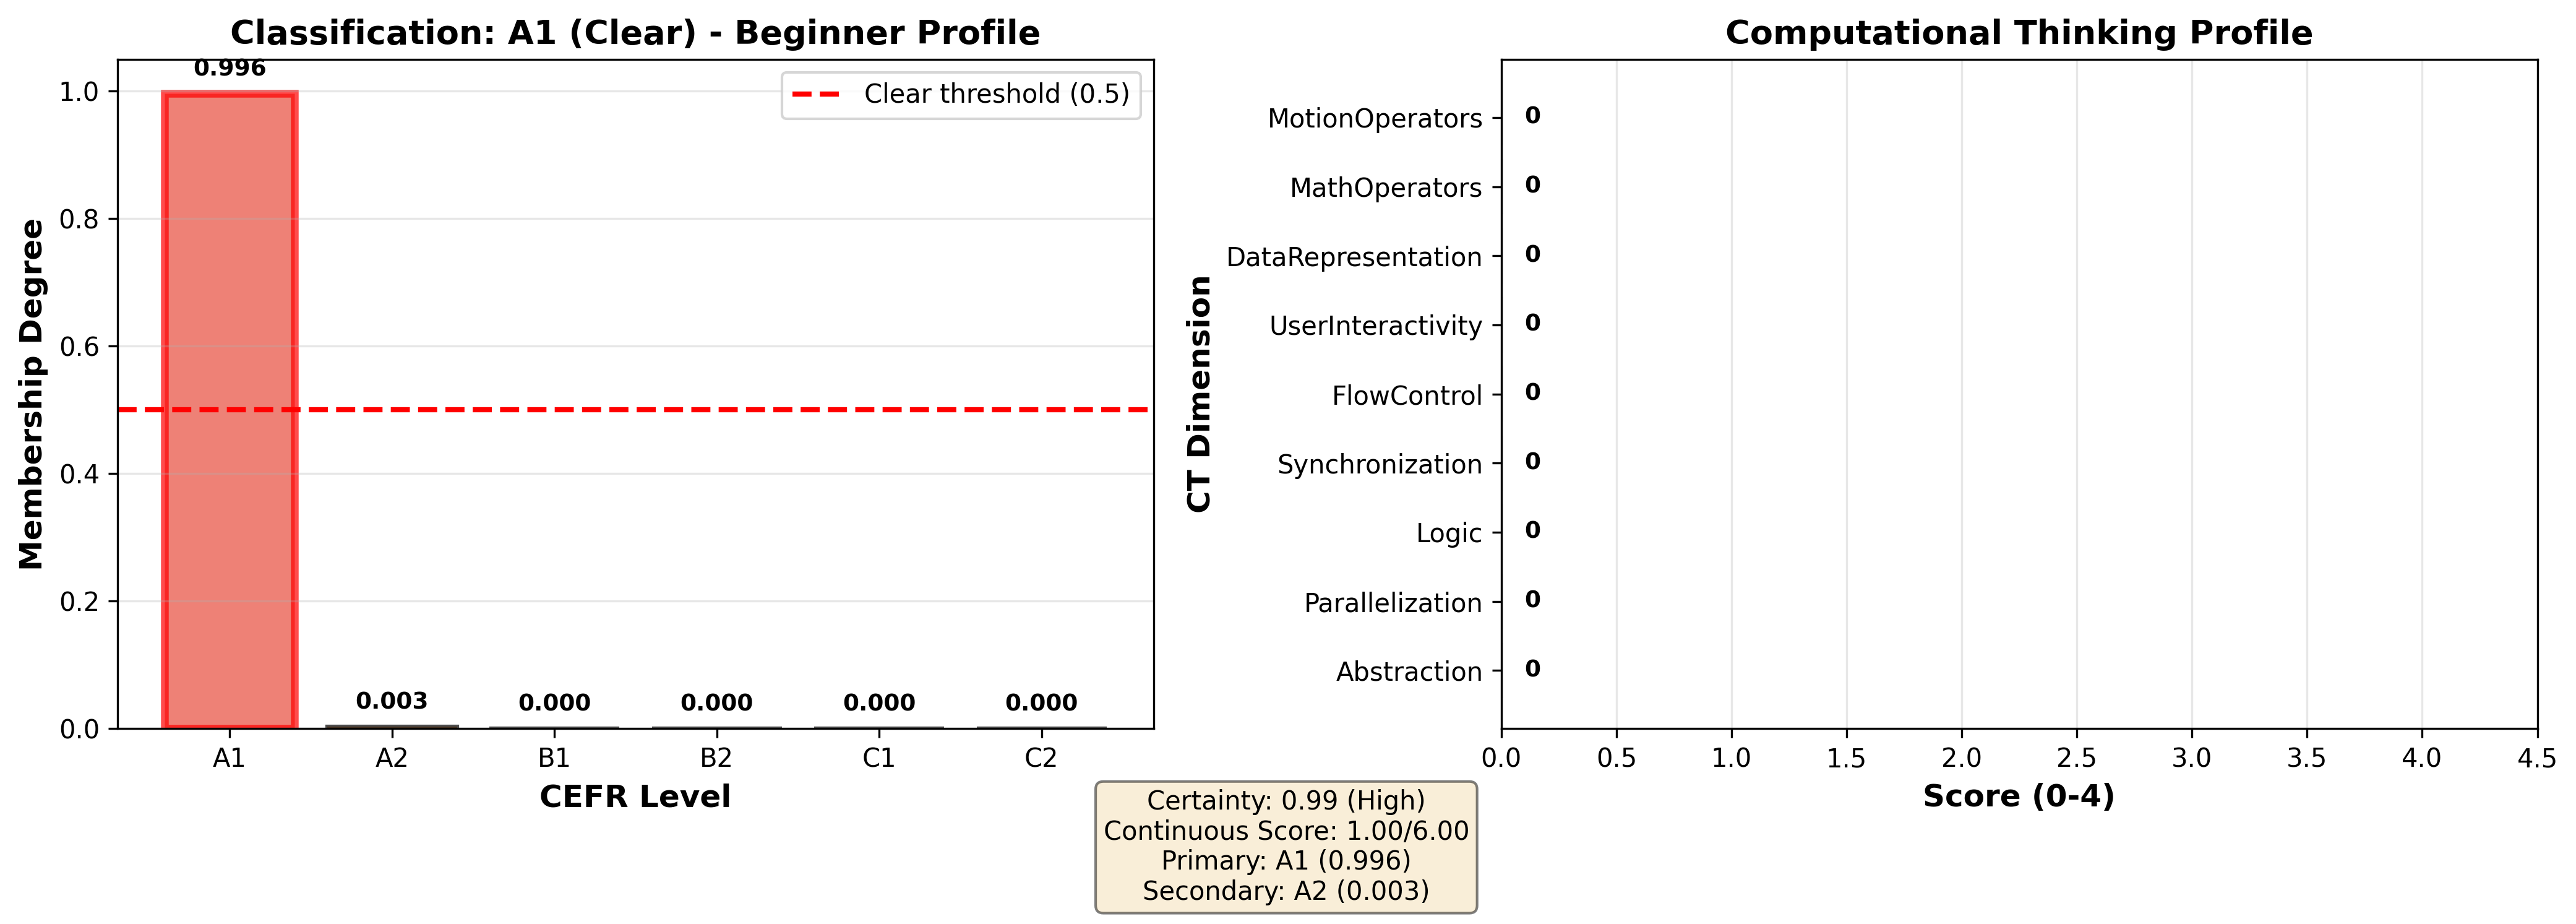
Figure 6: A1 (Clear) profile—complete beginner with no demonstrated CT competencies.
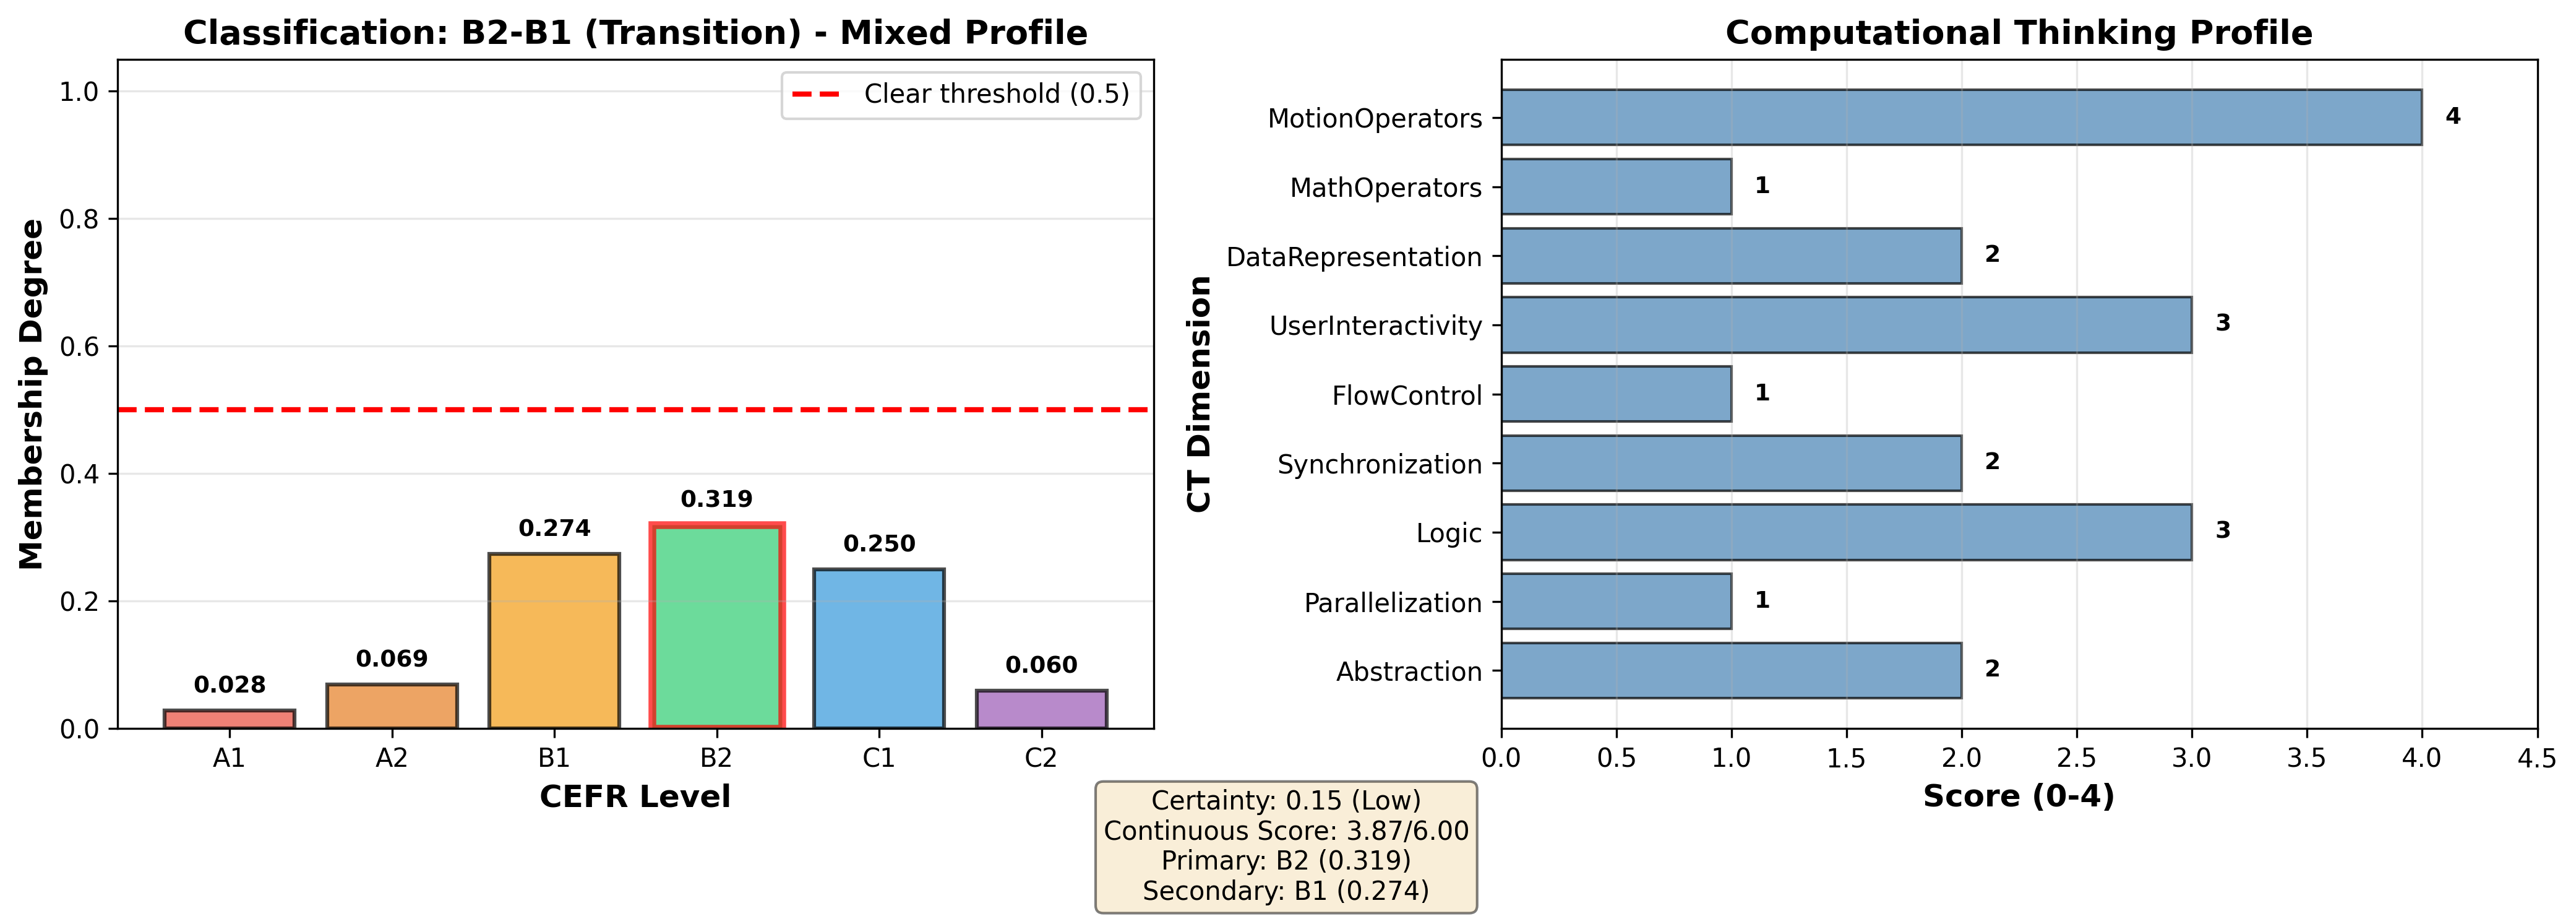
Figure 7: B2–B1 (Transition) profile—heterogeneous skill signature, substantial ambiguity in level assignment.
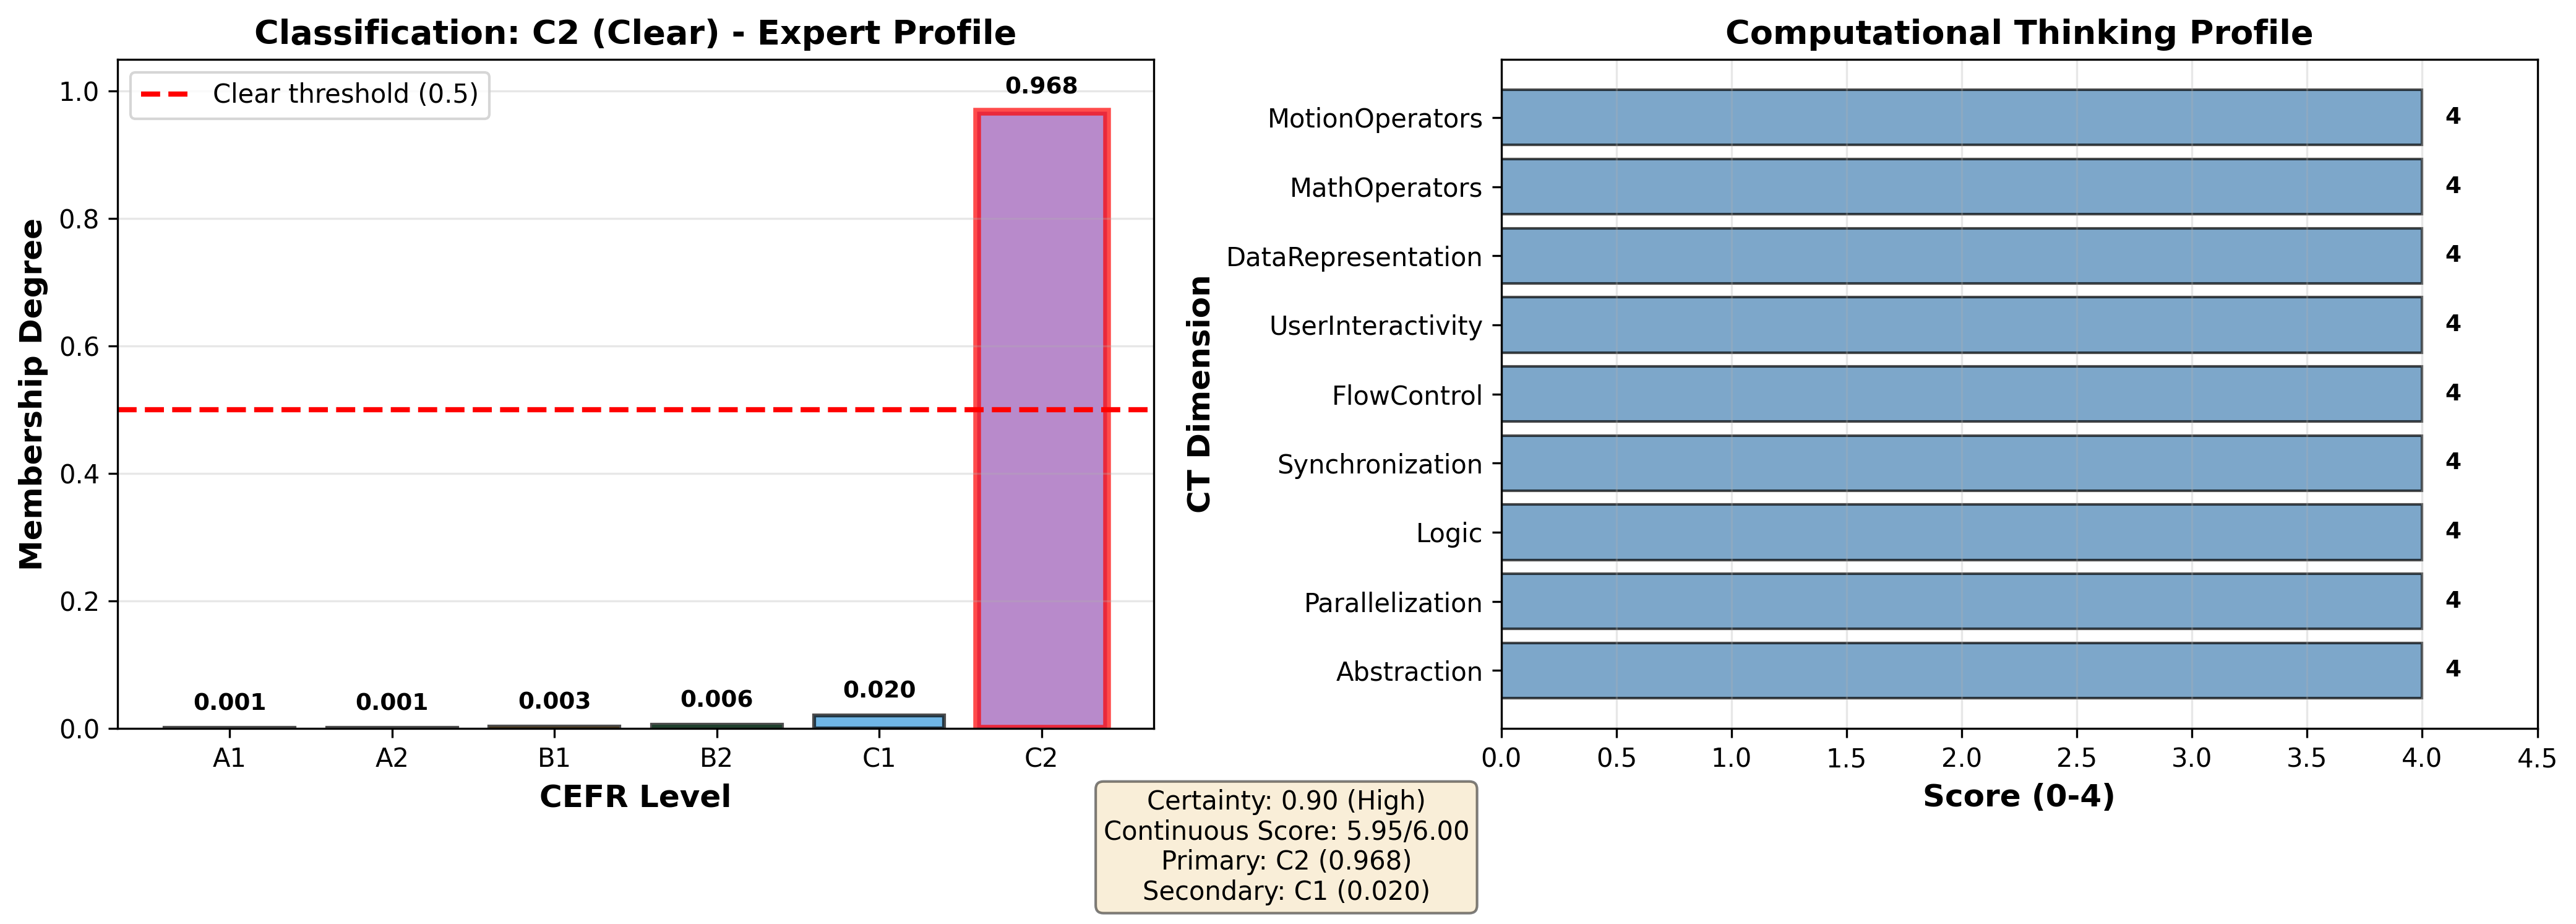
Figure 8: C2 (Clear) profile—uniform mastery across all CT dimensions, unambiguous expert classification.
Baseline Comparison
FCM outperforms MiniBatchKMeans and DBSCAN in preserving soft cluster boundaries and capturing transitional learners. KMeans is overly rigid with inflated APN, while DBSCAN fails to recover ordinal structure, producing fragmented and noisy outputs.
Implications
Educational Practice and Curriculum Design
The transition-centric framework enables precise diagnosis of systemic curriculum gaps, including empirically validated bottlenecks (B2) rooted in the cognitive load of synchronizing advanced CT constructs. By surfacing transition states and certainty-driven triage, educators can target interventions precisely where learners are most likely to benefit from human mediation or reinforced scaffolding.
The continuous and probabilistic nature of assessment supports adaptive progression, nuanced feedback, and mastery-based advancement, aligning with emerging trends in competency-based education. These findings inform strategic curriculum sequencing, with emphasis on Synchronization, Logic, and Data Representation as progression anchors, and early plateaued constructs (e.g., User Interactivity) as foundational.
Toward Standardized, Scalable Credentialing
Mapping to CEFR enables direct integration within international credentialing systems and alignment with DigCompEdu. Practical instantiations include blockchain-backed digital badges, standardized certification exams, and institutional analytics for workforce planning.
Potential Extensions and Limitations
Extensions include adaptation to text-based languages (e.g., Python) via language-agnostic CT metrics or AST-based representations, longitudinal tracking for progression modeling, multimodal assessment incorporating code quality, debugging, and collaboration, and validation across varied cultural or linguistic contexts. Limitations stem from domain specificity (Scratch), lack of creativity/elegance instrumentation, and cross-cultural generalizability.
Conclusion
This study establishes that FCM-based fuzzy ordinal clustering—mapped to the CEFR standard—constitutes a robust, interpretable, and scalable solution for automated programming skill assessment in Scratch. The methodology bridges categorical and continuous assessment, preserves essential information about learners in transition, and quantifies the epistemic uncertainty inherent in automated diagnostics. These features make the framework immediately relevant for large-scale learning analytics, adaptive educational technology, and competency-driven curriculum reform. The approach is generalizable to additional domains and directly supports institutional credentialing and personalized pedagogical intervention.